
Pearson eText for Statistical Reasoning for Everyday Life -- Instant Access (Pearson+)
5th Edition
ISBN: 9780137561544
Author: Jeffrey Bennett, William Briggs
Publisher: PEARSON+
expand_more
expand_more
format_list_bulleted
Concept explainers
Videos
Textbook Question
Chapter 4.3, Problem 20E
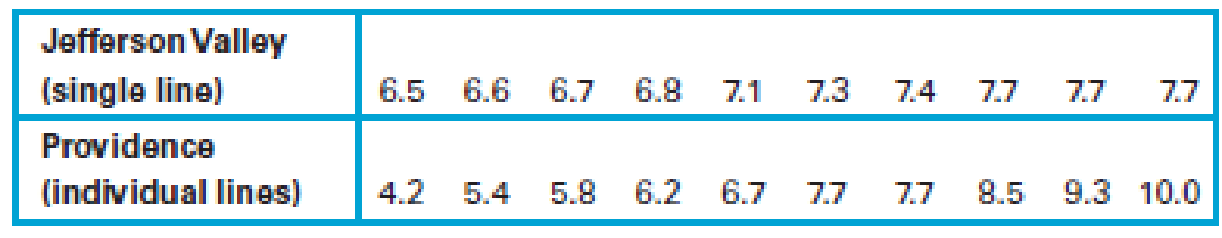
Comparing Variation. In Exercises 17–20, find the
20. Customer Waiting Times. Waiting times (in minutes) of customers at the Jefferson Valley Bank (where all customers enter a single waiting line) and the Bank of Providence (where customers wait in individual lines at three different teller windows) are listed below.
Expert Solution & Answer
Want to see the full answer?
Check out a sample textbook solution
Students have asked these similar questions
4. (5 pts) Conduct a chi-square contingency test (test of independence) to assess whether
there is an association between the behavior of the elderly person (did not stop to talk,
did stop to talk) and their likelihood of falling. Below, please state your null and
alternative hypotheses, calculate your expected values and write them in the table,
compute the test statistic, test the null by comparing your test statistic to the critical
value in Table A (p. 713-714) of your textbook and/or estimating the P-value, and
provide your conclusions in written form. Make sure to show your work.
Did not stop walking to talk
Stopped walking to talk
Suffered a fall
12
11
Totals
23
Did not suffer a fall | 2
Totals
35
37
14
46
60
T
Question 2
Parts manufactured by an injection molding process are subjected to a compressive strength test. Twenty samples
of five parts each are collected, and the compressive strengths (in psi) are shown in Table 2.
Table 2: Strength Data for Question 2
Sample Number
x1
x2
23
x4
x5
R
1
83.0
2
88.6 78.3 78.8
3
85.7
75.8
84.3
81.2 78.7 75.7 77.0
71.0 84.2
81.0
79.1
7.3
80.2 17.6
75.2
80.4
10.4
4
80.8
74.4
82.5
74.1 75.7 77.5
8.4
5
83.4
78.4
82.6 78.2
78.9
80.3
5.2
File Preview
6
75.3
79.9
87.3 89.7
81.8
82.8
14.5
7
74.5
78.0 80.8
73.4
79.7
77.3
7.4
8
79.2
84.4 81.5 86.0
74.5
81.1
11.4
9
80.5
86.2
76.2 64.1
80.2
81.4
9.9
10
75.7
75.2
71.1 82.1
74.3
75.7
10.9
11
80.0 81.5
78.4 73.8
78.1
78.4
7.7
12
80.6
81.8
79.3
73.8
81.7 79.4
8.0
13
82.7
81.3
79.1
82.0 79.5 80.9
3.6
14
79.2
74.9
78.6 77.7
75.3
77.1
4.3
15
85.5 82.1
82.8 73.4
71.7
79.1
13.8
16
78.8 79.6
80.2 79.1
80.8 79.7
2.0
17
82.1
78.2
18
84.5
76.9
75.5
83.5 81.2
19
79.0 77.8
20
84.5
73.1
78.2 82.1
79.2 81.1 7.6
81.2 84.4 81.6 80.8…
Name:
Lab Time:
Quiz 7 & 8 (Take Home) - due Wednesday, Feb. 26
Contingency Analysis (Ch. 9)
In lab 5, part 3, you will create a mosaic plot and conducted a chi-square contingency test to
evaluate whether elderly patients who did not stop walking to talk (vs. those who did stop)
were more likely to suffer a fall in the next six months. I have tabulated the data below.
Answer the questions below. Please show your calculations on this or a separate sheet.
Did not stop walking to talk
Stopped walking to talk Totals
Suffered a fall
Did not suffer a fall
Totals
12
11
23
2
35
37
14
14
46
60
Quiz 7:
1. (2 pts) Compute the odds of falling for each group. Compute the odds ratio for those
who did not stop walking vs. those who did stop walking. Interpret your result verbally.
Chapter 4 Solutions
Pearson eText for Statistical Reasoning for Everyday Life -- Instant Access (Pearson+)
Ch. 4.1 - Average. Define and distinguish among mean,...Ch. 4.1 - Outliers. What are outliers? Describe the effects...Ch. 4.1 - Average Confusion. Briefly describe at least two...Ch. 4.1 - Weighting. What is a weighted mean, and when is it...Ch. 4.1 - Does It Make Sense? For Exercises 59, determine...Ch. 4.1 - Does It Make Sense? For Exercises 59, determine...Ch. 4.1 - Mode. In an analysis of salaries paid to sales...Ch. 4.1 - Employment Data. A survey asked people their...Ch. 4.1 - Mean Wage. To find the mean wage of restaurant...Ch. 4.1 - Mean, Median, and Mode. In Exercises 1016, find...
Ch. 4.1 - Mean, Median, and Mode. In Exercises 1016, find...Ch. 4.1 - Mean, Median, and Mode. In Exercises 1016, find...Ch. 4.1 - Mean, Median, and Mode. In Exercises 1016, find...Ch. 4.1 - Mean, Median, and Mode. In Exercises 1016, find...Ch. 4.1 - Mean, Median, and Mode. In Exercises 1016, find...Ch. 4.1 - Mean, Median, and Mode. In Exercises 1016, find...Ch. 4.1 - Cell Phone Radiation. Listed below are...Ch. 4.1 - Alphabetic States. The states of Alabama, Alaska,...Ch. 4.1 - Outlier Coke. The contents of cans of regular...Ch. 4.1 - Raising Your Grade. Suppose you have scores of 80,...Ch. 4.1 - Raising Your Grade. Suppose you have scores of 60,...Ch. 4.1 - Comparing Data. In Exercises 2225, find the mean...Ch. 4.1 - Comparing Data. In Exercises 2225, find the mean...Ch. 4.1 - Comparing Data. In Exercises 2225, find the mean...Ch. 4.1 - Prob. 25ECh. 4.1 - Weighted Mean. Compute the weighte means in...Ch. 4.1 - Class Grade. Ryan is taking an advanced math class...Ch. 4.1 - GPA. One common system for computing a grade point...Ch. 4.1 - Prob. 29ECh. 4.1 - Prob. 30ECh. 4.1 - 31. Stockholder Voting. A small company has six...Ch. 4.1 - Weighted Mean. In Exercises 3235, find the mean of...Ch. 4.1 - Weighted Mean. In Exercises 3235, find the mean of...Ch. 4.1 - Weighted Mean. In Exercises 3235, find the mean of...Ch. 4.1 - Weighted Mean. In Exercises 3235, find the mean of...Ch. 4.1 - U.S. Population Center. Imagine taking a huge flat...Ch. 4.2 - Modes. Distinguish between a uniform distribution...Ch. 4.2 - Prob. 2ECh. 4.2 - Prob. 3ECh. 4.2 - Prob. 4ECh. 4.2 - Prob. 5ECh. 4.2 - Does It Make Sense? For Exercises 58, determine...Ch. 4.2 - Does It Make Sense? For Exercises 58, determine...Ch. 4.2 - Does It Make Sense? For Exercises 58, determine...Ch. 4.2 - Prob. 9ECh. 4.2 - Distributions. In Exercises 912, describe the...Ch. 4.2 - Distributions. In Exercises 912, describe the...Ch. 4.2 - Distributions. In Exercises 912, describe the...Ch. 4.2 - Baseball Salaries. In a recent year, the 868...Ch. 4.2 - Boston Rainfall. The daily rainfall amounts (in...Ch. 4.2 - Describing Distributions. For each distribution...Ch. 4.2 - Describing Distributions. For each distribution...Ch. 4.2 - Describing Distributions. For each distribution...Ch. 4.2 - Describing Distributions. For each distribution...Ch. 4.2 - Describing Distributions. For each distribution...Ch. 4.2 - Describing Distributions. For each distribution...Ch. 4.2 - Describing Distributions. For each distribution...Ch. 4.2 - Describing Distributions. For each distribution...Ch. 4.2 - Describing Distributions. For each distribution...Ch. 4.2 - Describing Distributions. For each distribution...Ch. 4.2 - Describing Distributions. For each distribution...Ch. 4.2 - Describing Distributions. For each distribution...Ch. 4.3 - Variation Matters. Consider two grocery stores at...Ch. 4.3 - Variation Measures. Briefly distinguish between...Ch. 4.3 - Quartiles and Percentiles. Briefly describe how...Ch. 4.3 - Standard Deviation. Describe the process of...Ch. 4.3 - Does It Make Sense? For Exercises 58, determine...Ch. 4.3 - Does It Make Sense? For Exercises 58, determine...Ch. 4.3 - Does It Make Sense? For Exercises 58, determine...Ch. 4.3 - Does It Make Sense? For Exercises 58, determine...Ch. 4.3 - Prob. 9ECh. 4.3 - Range and Standard Deviation. Exercises 916 each...Ch. 4.3 - Range and Standard Deviation. Exercises 916 each...Ch. 4.3 - Range and Standard Deviation. Exercises 916 each...Ch. 4.3 - Range and Standard Deviation. Exercises 916 each...Ch. 4.3 - Range and Standard Deviation. Exercises 916 each...Ch. 4.3 - Range and Standard Deviation. Exercises 916 each...Ch. 4.3 - Range and Standard Deviation. Exercises 916 each...Ch. 4.3 - Prob. 17ECh. 4.3 - Comparing Variation. In Exercises 1720, find the...Ch. 4.3 - Prob. 19ECh. 4.3 - Comparing Variation. In Exercises 1720, find the...Ch. 4.3 - Calculating Percentiles. A statistics professor...Ch. 4.3 - Calculating Percentiles. A data set consists of...Ch. 4.3 - Understanding Standard Deviation. The following...Ch. 4.3 - Understanding Standard Deviation. The following...Ch. 4.3 - Comparing Data Sets. For each of Exercises 2528,...Ch. 4.3 - Comparing Data Sets. For each of Exercises 2528,...Ch. 4.3 - Comparing Data Sets. For each of Exercises 2528,...Ch. 4.3 - Comparing Data Sets. For each of Exercises 2528,...Ch. 4.3 - Manufacturing. You are in charge of a...Ch. 4.3 - Prob. 30ECh. 4.3 - Prob. 31ECh. 4.3 - Prob. 32ECh. 4.4 - False Positive and False Negative. Professional...Ch. 4.4 - Positive Test Result. A professional soccer player...Ch. 4.4 - Prob. 3ECh. 4.4 - Prob. 4ECh. 4.4 - Does It Make Sense? For Exercises 58, determine...Ch. 4.4 - Does It Make Sense? For Exercises 58, determine...Ch. 4.4 - Does It Make Sense? For Exercises 58, determine...Ch. 4.4 - Does It Make Sense? For Exercises 58, determine...Ch. 4.4 - Prob. 9ECh. 4.4 - Passing Percentages. The table below shows the...Ch. 4.4 - Test Scores. The table below shows eighth-grade...Ch. 4.4 - Test Scores. Consider the following table...Ch. 4.4 - Prob. 13ECh. 4.4 - Prob. 14ECh. 4.4 - Basketball Records. Consider the following...Ch. 4.4 - Better Drug. Two drugs, A and B, were tested on a...Ch. 4.4 - Prob. 17ECh. 4.4 - Disease Test. Suppose a test for a disease is 80%...Ch. 4.4 - Prob. 19ECh. 4.4 - Drug Trials. (This problem is based on an example...Ch. 4.4 - HIV Risks. The New York State Department of Health...Ch. 4 - Chocolate Chips. Listed below are counts of the...Ch. 4 - Prob. 2CRECh. 4 - a. What is the standard deviation for a data set...Ch. 4 - When you add the earthquake magnitudes 2.45, 3.62,...Ch. 4 - Prob. 2CQCh. 4 - Prob. 3CQCh. 4 - Prob. 4CQCh. 4 - Prob. 5CQCh. 4 - Prob. 6CQCh. 4 - A histogram is constructed for a large set of...Ch. 4 - Prob. 8CQCh. 4 - Prob. 9CQCh. 4 - Identify the names of the components that...
Knowledge Booster


Learn more about
Need a deep-dive on the concept behind this application? Look no further. Learn more about this topic, statistics and related others by exploring similar questions and additional content below.Similar questions
- Solve please and thank you!arrow_forward7. In a 2011 article, M. Radelet and G. Pierce reported a logistic prediction equation for the death penalty verdicts in North Carolina. Let Y denote whether a subject convicted of murder received the death penalty (1=yes), for the defendant's race h (h1, black; h = 2, white), victim's race i (i = 1, black; i = 2, white), and number of additional factors j (j = 0, 1, 2). For the model logit[P(Y = 1)] = a + ß₁₂ + By + B²², they reported = -5.26, D â BD = 0, BD = 0.17, BY = 0, BY = 0.91, B = 0, B = 2.02, B = 3.98. (a) Estimate the probability of receiving the death penalty for the group most likely to receive it. [4 pts] (b) If, instead, parameters used constraints 3D = BY = 35 = 0, report the esti- mates. [3 pts] h (c) If, instead, parameters used constraints Σ₁ = Σ₁ BY = Σ; B = 0, report the estimates. [3 pts] Hint the probabilities, odds and odds ratios do not change with constraints.arrow_forwardSolve please and thank you!arrow_forward
- Solve please and thank you!arrow_forwardQuestion 1:We want to evaluate the impact on the monetary economy for a company of two types of strategy (competitive strategy, cooperative strategy) adopted by buyers.Competitive strategy: strategy characterized by firm behavior aimed at obtaining concessions from the buyer.Cooperative strategy: a strategy based on a problem-solving negotiating attitude, with a high level of trust and cooperation.A random sample of 17 buyers took part in a negotiation experiment in which 9 buyers adopted the competitive strategy, and the other 8 the cooperative strategy. The savings obtained for each group of buyers are presented in the pdf that i sent: For this problem, we assume that the samples are random and come from two normal populations of unknown but equal variances.According to the theory, the average saving of buyers adopting a competitive strategy will be lower than that of buyers adopting a cooperative strategy.a) Specify the population identifications and the hypotheses H0 and H1…arrow_forwardYou assume that the annual incomes for certain workers are normal with a mean of $28,500 and a standard deviation of $2,400. What’s the chance that a randomly selected employee makes more than $30,000?What’s the chance that 36 randomly selected employees make more than $30,000, on average?arrow_forward
- What’s the chance that a fair coin comes up heads more than 60 times when you toss it 100 times?arrow_forwardSuppose that you have a normal population of quiz scores with mean 40 and standard deviation 10. Select a random sample of 40. What’s the chance that the mean of the quiz scores won’t exceed 45?Select one individual from the population. What’s the chance that his/her quiz score won’t exceed 45?arrow_forwardSuppose that you take a sample of 100 from a population that contains 45 percent Democrats. What sample size condition do you need to check here (if any)?What’s the standard error of ^P?Compare the standard errors of ^p n=100 for ,n=1000 , n=10,000, and comment.arrow_forward
- Suppose that a class’s test scores have a mean of 80 and standard deviation of 5. You choose 25 students from the class. What’s the chance that the group’s average test score is more than 82?arrow_forwardSuppose that you collect data on 10 products and check their weights. The average should be 10 ounces, but your sample mean is 9 ounces with standard deviation 2 ounces. Find the standard score.What percentile is the standard score found in part a of this question closest to?Suppose that the mean really is 10 ounces. Do you find these results unusual? Use probabilities to explain.arrow_forwardSuppose that you want to sample expensive computer chips, but you can have only n=3 of them. Should you continue the experiment?arrow_forward
arrow_back_ios
SEE MORE QUESTIONS
arrow_forward_ios
Recommended textbooks for you
 Glencoe Algebra 1, Student Edition, 9780079039897...AlgebraISBN:9780079039897Author:CarterPublisher:McGraw Hill
 Big Ideas Math A Bridge To Success Algebra 1: Stu...AlgebraISBN:9781680331141Author:HOUGHTON MIFFLIN HARCOURTPublisher:Houghton Mifflin Harcourt
 Holt Mcdougal Larson Pre-algebra: Student Edition...AlgebraISBN:9780547587776Author:HOLT MCDOUGALPublisher:HOLT MCDOUGAL
 Linear Algebra: A Modern IntroductionAlgebraISBN:9781285463247Author:David PoolePublisher:Cengage Learning
Glencoe Algebra 1, Student Edition, 9780079039897...
Algebra
ISBN:9780079039897
Author:Carter
Publisher:McGraw Hill
Big Ideas Math A Bridge To Success Algebra 1: Stu...
Algebra
ISBN:9781680331141
Author:HOUGHTON MIFFLIN HARCOURT
Publisher:Houghton Mifflin Harcourt
Holt Mcdougal Larson Pre-algebra: Student Edition...
Algebra
ISBN:9780547587776
Author:HOLT MCDOUGAL
Publisher:HOLT MCDOUGAL
Linear Algebra: A Modern Introduction
Algebra
ISBN:9781285463247
Author:David Poole
Publisher:Cengage Learning
The Shape of Data: Distributions: Crash Course Statistics #7; Author: CrashCourse;https://www.youtube.com/watch?v=bPFNxD3Yg6U;License: Standard YouTube License, CC-BY
Shape, Center, and Spread - Module 20.2 (Part 1); Author: Mrmathblog;https://www.youtube.com/watch?v=COaid7O_Gag;License: Standard YouTube License, CC-BY
Shape, Center and Spread; Author: Emily Murdock;https://www.youtube.com/watch?v=_YyW0DSCzpM;License: Standard Youtube License