Concept explainers
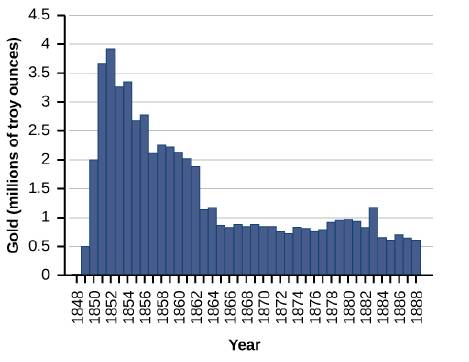
For the following exercises, consider the production of gold during the California gold rush (1848-1888). The production of gold can be modeled by

142. Find when the maximum (local and global) gold production occurred, and the amount of gold produced during that maximum.
Trending nowThis is a popular solution!

Chapter 4 Solutions
CALCULUS,VOLUME 1 (OER)
Additional Math Textbook Solutions
A First Course in Probability (10th Edition)
Calculus: Early Transcendentals (2nd Edition)
Elementary Statistics (13th Edition)
University Calculus: Early Transcendentals (4th Edition)
Thinking Mathematically (6th Edition)
- Can you help me with D and Earrow_forwardQ1.1 1 Point Any set {V1, V2, V3, V4} that consists of four different vectors from R cannot possibly span Rº. True False Save Answerarrow_forwardFind: lim x →-6 f (x) limx-4 f (x) lim x-1 f (x) lim x →4 f (x) (-6,3) • (-1,5) -8 -7 (-6,-2) 4+ (4,5) (4,2) • (-1,1) -6arrow_forward
- 3 2 Find: ƒ(1) lim f(x) 14-x 2 ƒ(2) lim f(x) x-2- lim f(x) x+2+ lim f(x) x→4 3 y=f(x)arrow_forwardFor each graph below, state whether it represents a function. Graph 1 24y Graph 2 Graph 3 4 2 -8 -6 -4 -2 -2 2 4 6 Function? ○ Yes ○ No ○ Yes ○ No Graph 4 Graph 5 8 Function? Yes No Yes No -2. ○ Yes ○ No Graph 6 4 + 2 4 -8 -6 -4 -2 2 4 6 8 Yes -4++ Noarrow_forwardStudents were asked to simplify the expression (secØ - cosØ)/secØ Two students' work is given.Student A: step 1 secØ/secØ - cosØ/secØstep 2 cosØ/1 - (1/cosØ)step 3 1 - cos^2Østep 4 sin^2ØStudent B: step 1 (1/cosØ)-cosØ)/secØstep 2 (1 - cos^2Ø/cosØ)/secØstep 3 sin^2Ø/cos^2Østep 4 tan^2ØPart A: Which student simplified the expression incorrectly? Explain the errors that were made or the formulas that were misused.Part B: Complete the student's solution correctly, beginning with the location of the error.arrow_forward
- Although 330° is a special angle on the unit circle, Amar wanted to determine its coordinates using the sum and difference formulas.Part A: Determine cos 330° using the cosine sum identity. Be sure to include all necessary work.Part B: Determine sin 330° using the sine difference identity. Be sure to include all necessary work.arrow_forwardA public health researcher is studying the impacts of nudge marketing techniques on shoppers vegetablesarrow_forward4. Let A {w, e, s, t, f, i, e, l, d, s, t, a, t, e}. (a) How many different words (they do not have to make sense) can you spell with the letters in A? (b) Is your answer from above the same as the cardinality of the powerset of A, i.e. of P(A)? (c) What is |A|?arrow_forward
- what can the answer be pls helparrow_forward5. How many numbers can you make out of the digits 1, 2, 3, 4, 6 if the rule is that every digit has to be larger than the digit preceding it? For example 124 is ok, 122 is not ok. Every digit can be used only once, but you do not have to use every digit. A tree might help.arrow_forward5 plsarrow_forward
 College Algebra (MindTap Course List)AlgebraISBN:9781305652231Author:R. David Gustafson, Jeff HughesPublisher:Cengage Learning
 College AlgebraAlgebraISBN:9781305115545Author:James Stewart, Lothar Redlin, Saleem WatsonPublisher:Cengage Learning
 Algebra and Trigonometry (MindTap Course List)AlgebraISBN:9781305071742Author:James Stewart, Lothar Redlin, Saleem WatsonPublisher:Cengage Learning

 Trigonometry (MindTap Course List)TrigonometryISBN:9781337278461Author:Ron LarsonPublisher:Cengage Learning


