
MyLab Statistics with Pearson eText -- Standalone Access Card -- for Elementary Statistics
13th Edition
ISBN: 9780134748535
Author: Mario F. Triola
Publisher: PEARSON
expand_more
expand_more
format_list_bulleted
Concept explainers
Videos
Textbook Question
Chapter 4.2, Problem 16BSC
In Exercises 9-20, use the data in the following table, which lists drive-thru order accuracy at popular fast food chains (data from a QSR Drive-Thru Study). Assume that orders are randomly selected from those included in the table.
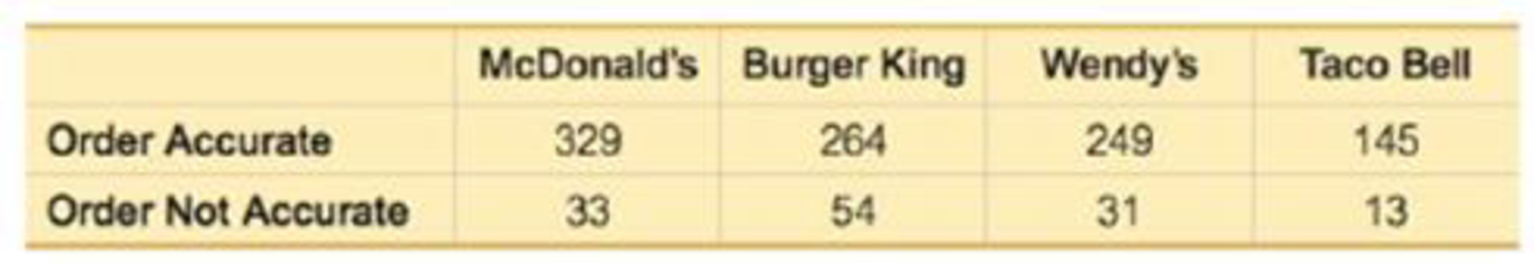
16. Fast Food Drive-Thru Accuracy If two orders are selected, find the
a. Assume that the selections are made with replacement. Are the
b. Assume that the selections are made without replacement. Are the events independent?
Expert Solution & Answer
Want to see the full answer?
Check out a sample textbook solution
Students have asked these similar questions
a. Find the value of A.b. Find pX(x) and py(y).c. Find pX|y(x|y) and py|X(y|x)d. Are x and y independent? Why or why not?
Analyze the residuals of a linear regression model and select the best response.Criteria is simple evaluation of possible indications of an exponential model vs. linear model)
no, the residual plot does not show a curve
yes, the residual plot does not show a curve
yes, the residual plot shows a curve
no, the residual plot shows a curve
I selected:
yes, the residual plot shows a curve and it is INCORRECT. Can u help me understand why?
You have been hired as an intern to run analyses on the data and report the results back to Sarah; the five questions that Sarah needs you to address are given below.
please do it step by step on excel
Does there appear to be a positive or negative relationship between price and screen size? Use a scatter plot to examine the relationship.
Determine and interpret the correlation coefficient between the two variables. In your interpretation, discuss the direction of the relationship (positive, negative, or zero relationship). Also discuss the strength of the relationship.
Estimate the relationship between screen size and price using a simple linear regression model and interpret the estimated coefficients. (In your interpretation, tell the dollar amount by which price will change for each unit of increase in screen size).
Include the manufacturer dummy variable (Samsung=1, 0 otherwise) and estimate the relationship between screen size, price and manufacturer dummy as a multiple…
Chapter 4 Solutions
MyLab Statistics with Pearson eText -- Standalone Access Card -- for Elementary Statistics
Ch. 4.1 - New Jersey Lottery Let A denote the event of...Ch. 4.1 - Probability Rewrite the following statement so...Ch. 4.1 - Interpreting Weather While this exercise was being...Ch. 4.1 - Subjective Probability Estimate the probability...Ch. 4.1 - Identifying Probability Values Which of the...Ch. 4.1 - Penicillin Who discovered penicillin: Sean Penn,...Ch. 4.1 - Avogadro Constant If you are asked on a quiz to...Ch. 4.1 - Births Example 2 in this section includes the...Ch. 4.1 - In Exercises 9-12, assume that 50 births are...Ch. 4.1 - In Exercises 9-12, assume that 50 births are...
Ch. 4.1 - In Exercises 9-12, assume that 50 births are...Ch. 4.1 - In Exercises 9-12, assume that 50 births are...Ch. 4.1 - In Exercises 13-20, express the indicated degree...Ch. 4.1 - SAT Test When making a random guess for an answer...Ch. 4.1 - In Exercises 13-20, express the indicated degree...Ch. 4.1 - In Exercises 13-20, express the indicated degree...Ch. 4.1 - Randomness When using a computer to randomly...Ch. 4.1 - In Exercises 13-20, express the indicated degree...Ch. 4.1 - In Exercises 13-20, express the indicated degree...Ch. 4.1 - In Exercises 13-20, express the indicated degree...Ch. 4.1 - In Exercises 21-24, refer to the sample data in...Ch. 4.1 - In Exercises 21-24, refer to the sample data in...Ch. 4.1 - In Exercises 21-24, refer to the sample data in...Ch. 4.1 - In Exercises 21-24, refer to the sample data in...Ch. 4.1 - In Exercises 25-32, find the probability and...Ch. 4.1 - In Exercises 25-32, find the probability and...Ch. 4.1 - In Exercises 25-32, find the probability and...Ch. 4.1 - In Exercises 25-32, find the probability and...Ch. 4.1 - In Exercises 25-32, find the probability and...Ch. 4.1 - In Exercises 25-32, find the probability and...Ch. 4.1 - In Exercises 25-32, find the probability and...Ch. 4.1 - In Exercises 25-32, find the probability and...Ch. 4.1 - Probability from a Sample Space. In Exercises...Ch. 4.1 - Probability from a Sample Space. In Exercises...Ch. 4.1 - Probability from a Sample Space. In Exercises...Ch. 4.1 - Probability from a Sample Space. In Exercises...Ch. 4.1 - Using Probability to Form Conclusions. In...Ch. 4.1 - Using Probability to Form Conclusions. In...Ch. 4.1 - Using Probability to Form Conclusions. In...Ch. 4.1 - Using Probability to Form Conclusions. In...Ch. 4.1 - Kentucky Pick 4 In the Kentucky Pick 4 lottery,...Ch. 4.1 - Finding Odds in Roulette A roulette wheel has 38...Ch. 4.1 - Kentucky Derby Odds When the horse California...Ch. 4.1 - Relative Risk and Odds Ratio In a clinical trial...Ch. 4.2 - Notation When randomly selecting an adult, A...Ch. 4.2 - Notation When randomly selecting adults, let M...Ch. 4.2 - Sample for a Poll There are 15,524,971 adults in...Ch. 4.2 - Rule of Complements When randomly selecting an...Ch. 4.2 - Finding Complements. In Exercises 5-8, find the...Ch. 4.2 - Finding Complements. In Exercises 5-8, find the...Ch. 4.2 - Finding Complements. In Exercises 5-8, find the...Ch. 4.2 - Finding Complements. In Exercises 5-8, find the...Ch. 4.2 - In Exercises 9-20, use the data in the following...Ch. 4.2 - In Exercises 9-20, use the data in the following...Ch. 4.2 - In Exercises 9-20, use the data in the following...Ch. 4.2 - In Exercises 9-20, use the data in the following...Ch. 4.2 - In Exercises 9-20; use the data in the following...Ch. 4.2 - In Exercises 9-20, use the data in the following...Ch. 4.2 - In Exercises 9-20, use the data in the following...Ch. 4.2 - In Exercises 9-20, use the data in the following...Ch. 4.2 - In Exercises 9-20, use the data in the following...Ch. 4.2 - In Exercises 9-20, use the data in the following...Ch. 4.2 - In Exercises 9-20, use the data in the following...Ch. 4.2 - In Exercises 9-20, use the data in the following...Ch. 4.2 - In Exercises 21-24, use these results from the...Ch. 4.2 - In Exercises 21-24, use these results from the...Ch. 4.2 - In Exercises 21-24, use these results from the...Ch. 4.2 - In Exercises 21-24, use these results from the...Ch. 4.2 - Redundancy. Exercises 25 and 26 involve...Ch. 4.2 - Redundancy. Exercises 25 and 26 involve...Ch. 4.2 - Acceptance Sampling. With one method of a...Ch. 4.2 - Acceptance Sampling. With one method of a...Ch. 4.2 - In Exercises 29 and 30, find the probabilities and...Ch. 4.2 - Prob. 30BSCCh. 4.2 - Surge Protectors Refer to the accompanying figure...Ch. 4.2 - Prob. 32BBCh. 4.2 - Exclusive Or The exclusive or means either one or...Ch. 4.2 - Complements and the Addition Rule Refer to the...Ch. 4.3 - Language: Complement of At Least One Let A = the...Ch. 4.3 - Probability of At Least One Let A = the event of...Ch. 4.3 - Notation When selecting one of your Facebook...Ch. 4.3 - Notation When selecting one of your Facebook...Ch. 4.3 - At Least One. In Exercises 5-12, find the...Ch. 4.3 - Probability of a Girl Assuming that boys and girls...Ch. 4.3 - At Least One. In Exercises 5-12, find the...Ch. 4.3 - At Least One. In Exercises 5-12, find the...Ch. 4.3 - At Least One. In Exercises 5-12, find the...Ch. 4.3 - At Least One. In Exercises 5-12, find the...Ch. 4.3 - At Least One. In Exercises 5-12, find the...Ch. 4.3 - At Least One. In Exercises 5-12, find the...Ch. 4.3 - Denomination Effect. In Exercises 13-16, use the...Ch. 4.3 - Denomination Effect. In Exercises 13-16, use the...Ch. 4.3 - Denomination Effect. In Exercises 13-16, use the...Ch. 4.3 - Denomination Effect. In Exercises 13-16, use the...Ch. 4.3 - In Exercises 17-20, refer to the accompanying...Ch. 4.3 - In Exercises 17-20, refer to the accompanying...Ch. 4.3 - In Exercises 17-20, refer to the accompanying...Ch. 4.3 - In Exercises 17-20, refer to the accompanying...Ch. 4.3 - Redundancy in Computer Hard Drives Assume that...Ch. 4.3 - Redundancy in Stadium Generators Large stadiums...Ch. 4.3 - Composite Drug Test Based on the data in Table 4-1...Ch. 4.3 - Composite Water Samples The Fairfield County...Ch. 4.3 - Shared Birthdays Find the probability that of 25...Ch. 4.4 - Notation What does the symbol ! represent? Six...Ch. 4.4 - New Jersey Pick 6 In the New Jersey Pick 6 lottery...Ch. 4.4 - Oregon Pick 4 In the Oregon Pick 4 lottery game, a...Ch. 4.4 - Combination Lock The typical combination lock uses...Ch. 4.4 - In Exercises 536, express all probabilities as...Ch. 4.4 - Social Security Numbers A Social Security number...Ch. 4.4 - Quinela In a horse race, a quinela bet is won if...Ch. 4.4 - Soccer Shootout In soccer, a tie at the end of...Ch. 4.4 - Grading Exams Your professor has just collected...Ch. 4.4 - Radio Station Call Letters If radio station call...Ch. 4.4 - Scheduling Routes A presidential candidate plans...Ch. 4.4 - Survey Reliability A survey with 12 questions is...Ch. 4.4 - Safety with Numbers The author owns a safe in...Ch. 4.4 - Electricity When testing for current in a cable...Ch. 4.4 - Sorting Hat At Hogwarts School of Witchcraft and...Ch. 4.4 - Moving Company The United Van Lines moving company...Ch. 4.4 - Powerball As of this writing, the Powerball...Ch. 4.4 - Teed Off When four golfers are about to begin a...Ch. 4.4 - ZIP Code If you randomly select five digits, each...Ch. 4.4 - FedEx Deliveries With a short time remaining in...Ch. 4.4 - Phone Numbers Current rules for telephone area...Ch. 4.4 - Classic Counting Problem A classic counting...Ch. 4.4 - Corporate Officers and Committees The Digital Pet...Ch. 4.4 - ATM You want to obtain cash by using an ATM, but...Ch. 4.4 - Party Mix DJ Marty T is hosting a party tonight...Ch. 4.4 - Identity Theft with Credit Cards Credit card...Ch. 4.4 - What a Word! One of the longest words in standard...Ch. 4.4 - Phase I of a Clinical Trial A clinical test on...Ch. 4.4 - Mega Millions As of this writing, the Mega...Ch. 4.4 - Designing Experiment Clinical trials of Nasonex...Ch. 4.4 - Morse Codes The International Morse code is a way...Ch. 4.4 - Mendels Peas Mendel conducted some his famous...Ch. 4.4 - Change for a Quarter How many different ways can...Ch. 4.4 - Counting with Fingers How many different ways can...Ch. 4.4 - Change for a Quarter How many different ways can...Ch. 4.4 - Win 1 Billion Quicken Loans offered a prize of 1...Ch. 4.4 - Computer Variable Names A common computer...Ch. 4.4 - High Fives a. Five mathletes celebrate after...Ch. 4 - Standard Tests Standard tests, such as the SAT or...Ch. 4 - Rain As the author is creating this exercise, a...Ch. 4 - Months If a month is randomly selected after...Ch. 4 - Social Networking Based on data from the Pew...Ch. 4 - Subjective Probability Estimate the probability...Ch. 4 - In Exercises 610, use the following results from...Ch. 4 - In Exercises 610, use the following results from...Ch. 4 - In Exercises 610, use the following results from...Ch. 4 - In Exercises 610, use the following results from...Ch. 4 - In Exercises 610, use the following results from...Ch. 4 - In Exercises 110, use the data in the accompanying...Ch. 4 - In Exercises 110, use the data in the accompanying...Ch. 4 - In Exercises 110, use the data in the accompanying...Ch. 4 - In Exercises 110, use the data in the accompanying...Ch. 4 - In Exercises 110, use the data in the accompanying...Ch. 4 - Prob. 6RECh. 4 - Prob. 7RECh. 4 - In Exercises 110, use the data in the accompanying...Ch. 4 - In Exercises 110, use the data in the accompanying...Ch. 4 - Prob. 10RECh. 4 - Black Cars Use subjective probability to estimate...Ch. 4 - Vision Correction About 75% of the U.S. population...Ch. 4 - National Statistics Day a. If a person is randomly...Ch. 4 - Composite Sampling for Diabetes Currently, the...Ch. 4 - Wild Card Lottery The Wild Card lottery is run in...Ch. 4 - Pennsylvania Cash 5 In the Pennsylvania Cash 5...Ch. 4 - Redundancy Using Braun battery-powered alarm...Ch. 4 - Exacta In a horse race, an exacta bet is won by...Ch. 4 - Fatal Drunk Driving Listed below are the blood...Ch. 4 - Fatal Drunk Driving Use the same data given in...Ch. 4 - Organ Donors USA Today provided information about...Ch. 4 - Sampling Eye Color Based on a study by Dr. P....Ch. 4 - Prob. 5CRECh. 4 - New Lottery Game In the Monopoly Millionaires Club...Ch. 4 - Critical Thinking: Interpreting results from a...Ch. 4 - Critical Thinking: Interpreting results from a...Ch. 4 - Critical Thinking: Interpreting results from a...Ch. 4 - Critical Thinking: Interpreting results from a...Ch. 4 - Critical Thinking: Interpreting results from a...Ch. 4 - Critical Thinking: Interpreting results from a...Ch. 4 - Critical Thinking: Interpreting results from a...Ch. 4 - Critical Thinking: Interpreting results from a...Ch. 4 - Critical Thinking: Interpreting results from a...
Knowledge Booster


Learn more about
Need a deep-dive on the concept behind this application? Look no further. Learn more about this topic, statistics and related others by exploring similar questions and additional content below.Similar questions
- Here is data with as the response variable. x y54.4 19.124.9 99.334.5 9.476.6 0.359.4 4.554.4 0.139.2 56.354 15.773.8 9-156.1 319.2Make a scatter plot of this data. Which point is an outlier? Enter as an ordered pair, e.g., (x,y). (x,y)= Find the regression equation for the data set without the outlier. Enter the equation of the form mx+b rounded to three decimal places. y_wo= Find the regression equation for the data set with the outlier. Enter the equation of the form mx+b rounded to three decimal places. y_w=arrow_forwardYou have been hired as an intern to run analyses on the data and report the results back to Sarah; the five questions that Sarah needs you to address are given below. please do it step by step Does there appear to be a positive or negative relationship between price and screen size? Use a scatter plot to examine the relationship. Determine and interpret the correlation coefficient between the two variables. In your interpretation, discuss the direction of the relationship (positive, negative, or zero relationship). Also discuss the strength of the relationship. Estimate the relationship between screen size and price using a simple linear regression model and interpret the estimated coefficients. (In your interpretation, tell the dollar amount by which price will change for each unit of increase in screen size). Include the manufacturer dummy variable (Samsung=1, 0 otherwise) and estimate the relationship between screen size, price and manufacturer dummy as a multiple linear…arrow_forwardExercises: Find all the whole number solutions of the congruence equation. 1. 3x 8 mod 11 2. 2x+3= 8 mod 12 3. 3x+12= 7 mod 10 4. 4x+6= 5 mod 8 5. 5x+3= 8 mod 12arrow_forward
- Scenario Sales of products by color follow a peculiar, but predictable, pattern that determines how many units will sell in any given year. This pattern is shown below Product Color 1995 1996 1997 Red 28 42 21 1998 23 1999 29 2000 2001 2002 Unit Sales 2003 2004 15 8 4 2 1 2005 2006 discontinued Green 26 39 20 22 28 14 7 4 2 White 43 65 33 36 45 23 12 Brown 58 87 44 48 60 Yellow 37 56 28 31 Black 28 42 21 Orange 19 29 Purple Total 28 42 21 49 68 78 95 123 176 181 164 127 24 179 Questions A) Which color will sell the most units in 2007? B) Which color will sell the most units combined in the 2007 to 2009 period? Please show all your analysis, leave formulas in cells, and specify any assumptions you make.arrow_forwardOne hundred students were surveyed about their preference between dogs and cats. The following two-way table displays data for the sample of students who responded to the survey. Preference Male Female TOTAL Prefers dogs \[36\] \[20\] \[56\] Prefers cats \[10\] \[26\] \[36\] No preference \[2\] \[6\] \[8\] TOTAL \[48\] \[52\] \[100\] problem 1 Find the probability that a randomly selected student prefers dogs.Enter your answer as a fraction or decimal. \[P\left(\text{prefers dogs}\right)=\] Incorrect Check Hide explanation Preference Male Female TOTAL Prefers dogs \[\blueD{36}\] \[\blueD{20}\] \[\blueE{56}\] Prefers cats \[10\] \[26\] \[36\] No preference \[2\] \[6\] \[8\] TOTAL \[48\] \[52\] \[100\] There were \[\blueE{56}\] students in the sample who preferred dogs out of \[100\] total students.arrow_forwardBusiness discussarrow_forward
- You have been hired as an intern to run analyses on the data and report the results back to Sarah; the five questions that Sarah needs you to address are given below. Does there appear to be a positive or negative relationship between price and screen size? Use a scatter plot to examine the relationship. Determine and interpret the correlation coefficient between the two variables. In your interpretation, discuss the direction of the relationship (positive, negative, or zero relationship). Also discuss the strength of the relationship. Estimate the relationship between screen size and price using a simple linear regression model and interpret the estimated coefficients. (In your interpretation, tell the dollar amount by which price will change for each unit of increase in screen size). Include the manufacturer dummy variable (Samsung=1, 0 otherwise) and estimate the relationship between screen size, price and manufacturer dummy as a multiple linear regression model. Interpret the…arrow_forwardDoes there appear to be a positive or negative relationship between price and screen size? Use a scatter plot to examine the relationship. How to take snapshots: if you use a MacBook, press Command+ Shift+4 to take snapshots. If you are using Windows, use the Snipping Tool to take snapshots. Question 1: Determine and interpret the correlation coefficient between the two variables. In your interpretation, discuss the direction of the relationship (positive, negative, or zero relationship). Also discuss the strength of the relationship. Value of correlation coefficient: Direction of the relationship (positive, negative, or zero relationship): Strength of the relationship (strong/moderate/weak): Question 2: Estimate the relationship between screen size and price using a simple linear regression model and interpret the estimated coefficients. In your interpretation, tell the dollar amount by which price will change for each unit of increase in screen size. (The answer for the…arrow_forwardIn this problem, we consider a Brownian motion (W+) t≥0. We consider a stock model (St)t>0 given (under the measure P) by d.St 0.03 St dt + 0.2 St dwt, with So 2. We assume that the interest rate is r = 0.06. The purpose of this problem is to price an option on this stock (which we name cubic put). This option is European-type, with maturity 3 months (i.e. T = 0.25 years), and payoff given by F = (8-5)+ (a) Write the Stochastic Differential Equation satisfied by (St) under the risk-neutral measure Q. (You don't need to prove it, simply give the answer.) (b) Give the price of a regular European put on (St) with maturity 3 months and strike K = 2. (c) Let X = S. Find the Stochastic Differential Equation satisfied by the process (Xt) under the measure Q. (d) Find an explicit expression for X₁ = S3 under measure Q. (e) Using the results above, find the price of the cubic put option mentioned above. (f) Is the price in (e) the same as in question (b)? (Explain why.)arrow_forward
- Problem 4. Margrabe formula and the Greeks (20 pts) In the homework, we determined the Margrabe formula for the price of an option allowing you to swap an x-stock for a y-stock at time T. For stocks with initial values xo, yo, common volatility σ and correlation p, the formula was given by Fo=yo (d+)-x0Þ(d_), where In (±² Ꭲ d+ õ√T and σ = σ√√√2(1 - p). дго (a) We want to determine a "Greek" for ỡ on the option: find a formula for θα (b) Is дго θα positive or negative? (c) We consider a situation in which the correlation p between the two stocks increases: what can you say about the price Fo? (d) Assume that yo< xo and p = 1. What is the price of the option?arrow_forwardWe consider a 4-dimensional stock price model given (under P) by dẴ₁ = µ· Xt dt + йt · ΣdŴt where (W) is an n-dimensional Brownian motion, π = (0.02, 0.01, -0.02, 0.05), 0.2 0 0 0 0.3 0.4 0 0 Σ= -0.1 -4a За 0 0.2 0.4 -0.1 0.2) and a E R. We assume that ☑0 = (1, 1, 1, 1) and that the interest rate on the market is r = 0.02. (a) Give a condition on a that would make stock #3 be the one with largest volatility. (b) Find the diversification coefficient for this portfolio as a function of a. (c) Determine the maximum diversification coefficient d that you could reach by varying the value of a? 2arrow_forwardQuestion 1. Your manager asks you to explain why the Black-Scholes model may be inappro- priate for pricing options in practice. Give one reason that would substantiate this claim? Question 2. We consider stock #1 and stock #2 in the model of Problem 2. Your manager asks you to pick only one of them to invest in based on the model provided. Which one do you choose and why ? Question 3. Let (St) to be an asset modeled by the Black-Scholes SDE. Let Ft be the price at time t of a European put with maturity T and strike price K. Then, the discounted option price process (ert Ft) t20 is a martingale. True or False? (Explain your answer.) Question 4. You are considering pricing an American put option using a Black-Scholes model for the underlying stock. An explicit formula for the price doesn't exist. In just a few words (no more than 2 sentences), explain how you would proceed to price it. Question 5. We model a short rate with a Ho-Lee model drt = ln(1+t) dt +2dWt. Then the interest rate…arrow_forward
arrow_back_ios
SEE MORE QUESTIONS
arrow_forward_ios
Recommended textbooks for you

 Holt Mcdougal Larson Pre-algebra: Student Edition...AlgebraISBN:9780547587776Author:HOLT MCDOUGALPublisher:HOLT MCDOUGAL
Holt Mcdougal Larson Pre-algebra: Student Edition...
Algebra
ISBN:9780547587776
Author:HOLT MCDOUGAL
Publisher:HOLT MCDOUGAL
Correlation Vs Regression: Difference Between them with definition & Comparison Chart; Author: Key Differences;https://www.youtube.com/watch?v=Ou2QGSJVd0U;License: Standard YouTube License, CC-BY
Correlation and Regression: Concepts with Illustrative examples; Author: LEARN & APPLY : Lean and Six Sigma;https://www.youtube.com/watch?v=xTpHD5WLuoA;License: Standard YouTube License, CC-BY