
MyLab Statistics with Pearson eText -- Standalone Access Card -- for Elementary Statistics
13th Edition
ISBN: 9780134748535
Author: Mario F. Triola
Publisher: PEARSON
expand_more
expand_more
format_list_bulleted
Concept explainers
Videos
Textbook Question
Chapter 4, Problem 9CQQ
In Exercises 6–10, use the following results from tests of an experiment to test the effectiveness of an experimental vaccine for children (based on data from USA Today). Express all probabilities in decimal form.
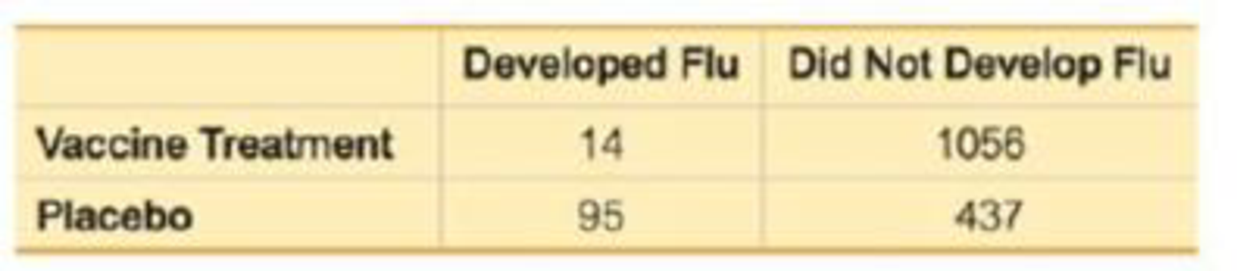
9. Find the
Expert Solution & Answer
Want to see the full answer?
Check out a sample textbook solution
Students have asked these similar questions
1. A consumer group claims that the mean annual consumption of cheddar cheese by a person in
the United States is at most 10.3 pounds. A random sample of 100 people in the United States has
a mean annual cheddar cheese consumption of 9.9 pounds. Assume the population standard
deviation is 2.1 pounds. At a = 0.05, can you reject the claim? (Adapted from U.S. Department of
Agriculture)
State the hypotheses:
Calculate the test statistic:
Calculate the P-value:
Conclusion (reject or fail to reject Ho):
2. The CEO of a manufacturing facility claims that the mean workday of the company's assembly
line employees is less than 8.5 hours. A random sample of 25 of the company's assembly line
employees has a mean workday of 8.2 hours. Assume the population standard deviation is 0.5
hour and the population is normally distributed. At a = 0.01, test the CEO's claim.
State the hypotheses:
Calculate the test statistic:
Calculate the P-value:
Conclusion (reject or fail to reject Ho):
Statistics
21.
find the mean.
and
variance of the
following:
Ⓒ x(t) = Ut +V, and V indepriv. s.t
U.VN NL0, 63).
X(t) = t² + Ut +V, U and V incepires have N (0,8)
Ut
①xt = e UNN (0162)
~ X+ = UCOSTE, UNNL0, 62)
SU, Oct
⑤Xt=
7
where U. Vindp.rus
+> ½
have NL, 62).
⑥Xn = ΣY, 41, 42, 43, ... Yn vandom sample
K=1
Text
with mean zen and variance 6
A psychology researcher conducted a Chi-Square Test of Independence to examine whether there is a relationship between college students’ year in school (Freshman, Sophomore, Junior, Senior) and their preferred coping strategy for academic stress (Problem-Focused, Emotion-Focused, Avoidance). The test yielded the following result:
image.png
Interpret the results of this analysis. In your response, clearly explain:
Whether the result is statistically significant and why.
What this means about the relationship between year in school and coping strategy.
What the researcher should conclude based on these findings.
Chapter 4 Solutions
MyLab Statistics with Pearson eText -- Standalone Access Card -- for Elementary Statistics
Ch. 4.1 - New Jersey Lottery Let A denote the event of...Ch. 4.1 - Probability Rewrite the following statement so...Ch. 4.1 - Interpreting Weather While this exercise was being...Ch. 4.1 - Subjective Probability Estimate the probability...Ch. 4.1 - Identifying Probability Values Which of the...Ch. 4.1 - Penicillin Who discovered penicillin: Sean Penn,...Ch. 4.1 - Avogadro Constant If you are asked on a quiz to...Ch. 4.1 - Births Example 2 in this section includes the...Ch. 4.1 - In Exercises 9-12, assume that 50 births are...Ch. 4.1 - In Exercises 9-12, assume that 50 births are...
Ch. 4.1 - In Exercises 9-12, assume that 50 births are...Ch. 4.1 - In Exercises 9-12, assume that 50 births are...Ch. 4.1 - In Exercises 13-20, express the indicated degree...Ch. 4.1 - SAT Test When making a random guess for an answer...Ch. 4.1 - In Exercises 13-20, express the indicated degree...Ch. 4.1 - In Exercises 13-20, express the indicated degree...Ch. 4.1 - Randomness When using a computer to randomly...Ch. 4.1 - In Exercises 13-20, express the indicated degree...Ch. 4.1 - In Exercises 13-20, express the indicated degree...Ch. 4.1 - In Exercises 13-20, express the indicated degree...Ch. 4.1 - In Exercises 21-24, refer to the sample data in...Ch. 4.1 - In Exercises 21-24, refer to the sample data in...Ch. 4.1 - In Exercises 21-24, refer to the sample data in...Ch. 4.1 - In Exercises 21-24, refer to the sample data in...Ch. 4.1 - In Exercises 25-32, find the probability and...Ch. 4.1 - In Exercises 25-32, find the probability and...Ch. 4.1 - In Exercises 25-32, find the probability and...Ch. 4.1 - In Exercises 25-32, find the probability and...Ch. 4.1 - In Exercises 25-32, find the probability and...Ch. 4.1 - In Exercises 25-32, find the probability and...Ch. 4.1 - In Exercises 25-32, find the probability and...Ch. 4.1 - In Exercises 25-32, find the probability and...Ch. 4.1 - Probability from a Sample Space. In Exercises...Ch. 4.1 - Probability from a Sample Space. In Exercises...Ch. 4.1 - Probability from a Sample Space. In Exercises...Ch. 4.1 - Probability from a Sample Space. In Exercises...Ch. 4.1 - Using Probability to Form Conclusions. In...Ch. 4.1 - Using Probability to Form Conclusions. In...Ch. 4.1 - Using Probability to Form Conclusions. In...Ch. 4.1 - Using Probability to Form Conclusions. In...Ch. 4.1 - Kentucky Pick 4 In the Kentucky Pick 4 lottery,...Ch. 4.1 - Finding Odds in Roulette A roulette wheel has 38...Ch. 4.1 - Kentucky Derby Odds When the horse California...Ch. 4.1 - Relative Risk and Odds Ratio In a clinical trial...Ch. 4.2 - Notation When randomly selecting an adult, A...Ch. 4.2 - Notation When randomly selecting adults, let M...Ch. 4.2 - Sample for a Poll There are 15,524,971 adults in...Ch. 4.2 - Rule of Complements When randomly selecting an...Ch. 4.2 - Finding Complements. In Exercises 5-8, find the...Ch. 4.2 - Finding Complements. In Exercises 5-8, find the...Ch. 4.2 - Finding Complements. In Exercises 5-8, find the...Ch. 4.2 - Finding Complements. In Exercises 5-8, find the...Ch. 4.2 - In Exercises 9-20, use the data in the following...Ch. 4.2 - In Exercises 9-20, use the data in the following...Ch. 4.2 - In Exercises 9-20, use the data in the following...Ch. 4.2 - In Exercises 9-20, use the data in the following...Ch. 4.2 - In Exercises 9-20; use the data in the following...Ch. 4.2 - In Exercises 9-20, use the data in the following...Ch. 4.2 - In Exercises 9-20, use the data in the following...Ch. 4.2 - In Exercises 9-20, use the data in the following...Ch. 4.2 - In Exercises 9-20, use the data in the following...Ch. 4.2 - In Exercises 9-20, use the data in the following...Ch. 4.2 - In Exercises 9-20, use the data in the following...Ch. 4.2 - In Exercises 9-20, use the data in the following...Ch. 4.2 - In Exercises 21-24, use these results from the...Ch. 4.2 - In Exercises 21-24, use these results from the...Ch. 4.2 - In Exercises 21-24, use these results from the...Ch. 4.2 - In Exercises 21-24, use these results from the...Ch. 4.2 - Redundancy. Exercises 25 and 26 involve...Ch. 4.2 - Redundancy. Exercises 25 and 26 involve...Ch. 4.2 - Acceptance Sampling. With one method of a...Ch. 4.2 - Acceptance Sampling. With one method of a...Ch. 4.2 - In Exercises 29 and 30, find the probabilities and...Ch. 4.2 - Prob. 30BSCCh. 4.2 - Surge Protectors Refer to the accompanying figure...Ch. 4.2 - Prob. 32BBCh. 4.2 - Exclusive Or The exclusive or means either one or...Ch. 4.2 - Complements and the Addition Rule Refer to the...Ch. 4.3 - Language: Complement of At Least One Let A = the...Ch. 4.3 - Probability of At Least One Let A = the event of...Ch. 4.3 - Notation When selecting one of your Facebook...Ch. 4.3 - Notation When selecting one of your Facebook...Ch. 4.3 - At Least One. In Exercises 5-12, find the...Ch. 4.3 - Probability of a Girl Assuming that boys and girls...Ch. 4.3 - At Least One. In Exercises 5-12, find the...Ch. 4.3 - At Least One. In Exercises 5-12, find the...Ch. 4.3 - At Least One. In Exercises 5-12, find the...Ch. 4.3 - At Least One. In Exercises 5-12, find the...Ch. 4.3 - At Least One. In Exercises 5-12, find the...Ch. 4.3 - At Least One. In Exercises 5-12, find the...Ch. 4.3 - Denomination Effect. In Exercises 13-16, use the...Ch. 4.3 - Denomination Effect. In Exercises 13-16, use the...Ch. 4.3 - Denomination Effect. In Exercises 13-16, use the...Ch. 4.3 - Denomination Effect. In Exercises 13-16, use the...Ch. 4.3 - In Exercises 17-20, refer to the accompanying...Ch. 4.3 - In Exercises 17-20, refer to the accompanying...Ch. 4.3 - In Exercises 17-20, refer to the accompanying...Ch. 4.3 - In Exercises 17-20, refer to the accompanying...Ch. 4.3 - Redundancy in Computer Hard Drives Assume that...Ch. 4.3 - Redundancy in Stadium Generators Large stadiums...Ch. 4.3 - Composite Drug Test Based on the data in Table 4-1...Ch. 4.3 - Composite Water Samples The Fairfield County...Ch. 4.3 - Shared Birthdays Find the probability that of 25...Ch. 4.4 - Notation What does the symbol ! represent? Six...Ch. 4.4 - New Jersey Pick 6 In the New Jersey Pick 6 lottery...Ch. 4.4 - Oregon Pick 4 In the Oregon Pick 4 lottery game, a...Ch. 4.4 - Combination Lock The typical combination lock uses...Ch. 4.4 - In Exercises 536, express all probabilities as...Ch. 4.4 - Social Security Numbers A Social Security number...Ch. 4.4 - Quinela In a horse race, a quinela bet is won if...Ch. 4.4 - Soccer Shootout In soccer, a tie at the end of...Ch. 4.4 - Grading Exams Your professor has just collected...Ch. 4.4 - Radio Station Call Letters If radio station call...Ch. 4.4 - Scheduling Routes A presidential candidate plans...Ch. 4.4 - Survey Reliability A survey with 12 questions is...Ch. 4.4 - Safety with Numbers The author owns a safe in...Ch. 4.4 - Electricity When testing for current in a cable...Ch. 4.4 - Sorting Hat At Hogwarts School of Witchcraft and...Ch. 4.4 - Moving Company The United Van Lines moving company...Ch. 4.4 - Powerball As of this writing, the Powerball...Ch. 4.4 - Teed Off When four golfers are about to begin a...Ch. 4.4 - ZIP Code If you randomly select five digits, each...Ch. 4.4 - FedEx Deliveries With a short time remaining in...Ch. 4.4 - Phone Numbers Current rules for telephone area...Ch. 4.4 - Classic Counting Problem A classic counting...Ch. 4.4 - Corporate Officers and Committees The Digital Pet...Ch. 4.4 - ATM You want to obtain cash by using an ATM, but...Ch. 4.4 - Party Mix DJ Marty T is hosting a party tonight...Ch. 4.4 - Identity Theft with Credit Cards Credit card...Ch. 4.4 - What a Word! One of the longest words in standard...Ch. 4.4 - Phase I of a Clinical Trial A clinical test on...Ch. 4.4 - Mega Millions As of this writing, the Mega...Ch. 4.4 - Designing Experiment Clinical trials of Nasonex...Ch. 4.4 - Morse Codes The International Morse code is a way...Ch. 4.4 - Mendels Peas Mendel conducted some his famous...Ch. 4.4 - Change for a Quarter How many different ways can...Ch. 4.4 - Counting with Fingers How many different ways can...Ch. 4.4 - Change for a Quarter How many different ways can...Ch. 4.4 - Win 1 Billion Quicken Loans offered a prize of 1...Ch. 4.4 - Computer Variable Names A common computer...Ch. 4.4 - High Fives a. Five mathletes celebrate after...Ch. 4 - Standard Tests Standard tests, such as the SAT or...Ch. 4 - Rain As the author is creating this exercise, a...Ch. 4 - Months If a month is randomly selected after...Ch. 4 - Social Networking Based on data from the Pew...Ch. 4 - Subjective Probability Estimate the probability...Ch. 4 - In Exercises 610, use the following results from...Ch. 4 - In Exercises 610, use the following results from...Ch. 4 - In Exercises 610, use the following results from...Ch. 4 - In Exercises 610, use the following results from...Ch. 4 - In Exercises 610, use the following results from...Ch. 4 - In Exercises 110, use the data in the accompanying...Ch. 4 - In Exercises 110, use the data in the accompanying...Ch. 4 - In Exercises 110, use the data in the accompanying...Ch. 4 - In Exercises 110, use the data in the accompanying...Ch. 4 - In Exercises 110, use the data in the accompanying...Ch. 4 - Prob. 6RECh. 4 - Prob. 7RECh. 4 - In Exercises 110, use the data in the accompanying...Ch. 4 - In Exercises 110, use the data in the accompanying...Ch. 4 - Prob. 10RECh. 4 - Black Cars Use subjective probability to estimate...Ch. 4 - Vision Correction About 75% of the U.S. population...Ch. 4 - National Statistics Day a. If a person is randomly...Ch. 4 - Composite Sampling for Diabetes Currently, the...Ch. 4 - Wild Card Lottery The Wild Card lottery is run in...Ch. 4 - Pennsylvania Cash 5 In the Pennsylvania Cash 5...Ch. 4 - Redundancy Using Braun battery-powered alarm...Ch. 4 - Exacta In a horse race, an exacta bet is won by...Ch. 4 - Fatal Drunk Driving Listed below are the blood...Ch. 4 - Fatal Drunk Driving Use the same data given in...Ch. 4 - Organ Donors USA Today provided information about...Ch. 4 - Sampling Eye Color Based on a study by Dr. P....Ch. 4 - Prob. 5CRECh. 4 - New Lottery Game In the Monopoly Millionaires Club...Ch. 4 - Critical Thinking: Interpreting results from a...Ch. 4 - Critical Thinking: Interpreting results from a...Ch. 4 - Critical Thinking: Interpreting results from a...Ch. 4 - Critical Thinking: Interpreting results from a...Ch. 4 - Critical Thinking: Interpreting results from a...Ch. 4 - Critical Thinking: Interpreting results from a...Ch. 4 - Critical Thinking: Interpreting results from a...Ch. 4 - Critical Thinking: Interpreting results from a...Ch. 4 - Critical Thinking: Interpreting results from a...
Knowledge Booster


Learn more about
Need a deep-dive on the concept behind this application? Look no further. Learn more about this topic, statistics and related others by exploring similar questions and additional content below.Similar questions
- A school counselor is conducting a research study to examine whether there is a relationship between the number of times teenagers report vaping per week and their academic performance, measured by GPA. The counselor collects data from a sample of high school students. Write the null and alternative hypotheses for this study. Clearly state your hypotheses in terms of the correlation between vaping frequency and academic performance. EditViewInsertFormatToolsTable 12pt Paragrapharrow_forwardA smallish urn contains 25 small plastic bunnies – 7 of which are pink and 18 of which are white. 10 bunnies are drawn from the urn at random with replacement, and X is the number of pink bunnies that are drawn. (a) P(X = 5) ≈ (b) P(X<6) ≈ The Whoville small urn contains 100 marbles – 60 blue and 40 orange. The Grinch sneaks in one night and grabs a simple random sample (without replacement) of 15 marbles. (a) The probability that the Grinch gets exactly 6 blue marbles is [ Select ] ["≈ 0.054", "≈ 0.043", "≈ 0.061"] . (b) The probability that the Grinch gets at least 7 blue marbles is [ Select ] ["≈ 0.922", "≈ 0.905", "≈ 0.893"] . (c) The probability that the Grinch gets between 8 and 12 blue marbles (inclusive) is [ Select ] ["≈ 0.801", "≈ 0.760", "≈ 0.786"] . The Whoville small urn contains 100 marbles – 60 blue and 40 orange. The Grinch sneaks in one night and grabs a simple random sample (without replacement) of 15 marbles. (a)…arrow_forwardSuppose an experiment was conducted to compare the mileage(km) per litre obtained by competing brands of petrol I,II,III. Three new Mazda, three new Toyota and three new Nissan cars were available for experimentation. During the experiment the cars would operate under same conditions in order to eliminate the effect of external variables on the distance travelled per litre on the assigned brand of petrol. The data is given as below: Brands of Petrol Mazda Toyota Nissan I 10.6 12.0 11.0 II 9.0 15.0 12.0 III 12.0 17.4 13.0 (a) Test at the 5% level of significance whether there are signi cant differences among the brands of fuels and also among the cars. [10] (b) Compute the standard error for comparing any two fuel brands means. Hence compare, at the 5% level of significance, each of fuel brands II, and III with the standard fuel brand I. [10] �arrow_forward
- Analyze the residuals of a linear regression model and select the best response. yes, the residual plot does not show a curve no, the residual plot shows a curve yes, the residual plot shows a curve no, the residual plot does not show a curve I answered, "No, the residual plot shows a curve." (and this was incorrect). I am not sure why I keep getting these wrong when the answer seems obvious. Please help me understand what the yes and no references in the answer.arrow_forwarda. Find the value of A.b. Find pX(x) and py(y).c. Find pX|y(x|y) and py|X(y|x)d. Are x and y independent? Why or why not?arrow_forwardAnalyze the residuals of a linear regression model and select the best response.Criteria is simple evaluation of possible indications of an exponential model vs. linear model) no, the residual plot does not show a curve yes, the residual plot does not show a curve yes, the residual plot shows a curve no, the residual plot shows a curve I selected: yes, the residual plot shows a curve and it is INCORRECT. Can u help me understand why?arrow_forward
- You have been hired as an intern to run analyses on the data and report the results back to Sarah; the five questions that Sarah needs you to address are given below. please do it step by step on excel Does there appear to be a positive or negative relationship between price and screen size? Use a scatter plot to examine the relationship. Determine and interpret the correlation coefficient between the two variables. In your interpretation, discuss the direction of the relationship (positive, negative, or zero relationship). Also discuss the strength of the relationship. Estimate the relationship between screen size and price using a simple linear regression model and interpret the estimated coefficients. (In your interpretation, tell the dollar amount by which price will change for each unit of increase in screen size). Include the manufacturer dummy variable (Samsung=1, 0 otherwise) and estimate the relationship between screen size, price and manufacturer dummy as a multiple…arrow_forwardHere is data with as the response variable. x y54.4 19.124.9 99.334.5 9.476.6 0.359.4 4.554.4 0.139.2 56.354 15.773.8 9-156.1 319.2Make a scatter plot of this data. Which point is an outlier? Enter as an ordered pair, e.g., (x,y). (x,y)= Find the regression equation for the data set without the outlier. Enter the equation of the form mx+b rounded to three decimal places. y_wo= Find the regression equation for the data set with the outlier. Enter the equation of the form mx+b rounded to three decimal places. y_w=arrow_forwardYou have been hired as an intern to run analyses on the data and report the results back to Sarah; the five questions that Sarah needs you to address are given below. please do it step by step Does there appear to be a positive or negative relationship between price and screen size? Use a scatter plot to examine the relationship. Determine and interpret the correlation coefficient between the two variables. In your interpretation, discuss the direction of the relationship (positive, negative, or zero relationship). Also discuss the strength of the relationship. Estimate the relationship between screen size and price using a simple linear regression model and interpret the estimated coefficients. (In your interpretation, tell the dollar amount by which price will change for each unit of increase in screen size). Include the manufacturer dummy variable (Samsung=1, 0 otherwise) and estimate the relationship between screen size, price and manufacturer dummy as a multiple linear…arrow_forward
arrow_back_ios
SEE MORE QUESTIONS
arrow_forward_ios
Recommended textbooks for you
 Holt Mcdougal Larson Pre-algebra: Student Edition...AlgebraISBN:9780547587776Author:HOLT MCDOUGALPublisher:HOLT MCDOUGAL

Holt Mcdougal Larson Pre-algebra: Student Edition...
Algebra
ISBN:9780547587776
Author:HOLT MCDOUGAL
Publisher:HOLT MCDOUGAL
Probability & Statistics (28 of 62) Basic Definitions and Symbols Summarized; Author: Michel van Biezen;https://www.youtube.com/watch?v=21V9WBJLAL8;License: Standard YouTube License, CC-BY
Introduction to Probability, Basic Overview - Sample Space, & Tree Diagrams; Author: The Organic Chemistry Tutor;https://www.youtube.com/watch?v=SkidyDQuupA;License: Standard YouTube License, CC-BY