
Concept explainers
Videos
Use a calculator with an
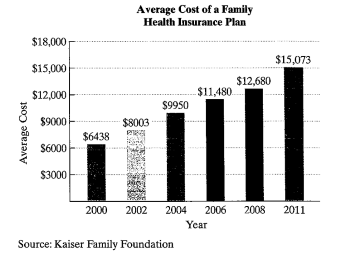
Average annual premiums for employer-sponsored family health insurance policies more than doubled over 11 years The bar graph shows the average cost of a family health insurance plan in the United States for six selected years from 2000 through 2011.
The data can be modeled by
model the percentage of college graduates, among people ages 25 and older, f(x) or g(x), x years after 1950. Use these functions to solve Exercises 75–76.
Which function is a better model for the percentage who were college graduates in 2009?

Trending nowThis is a popular solution!

Chapter 4 Solutions
Algebra and Trigonometry


- There were 426 books sold in one week. The number of biology books sold was 5 times that of the number of psychology books. How many books each were sold?arrow_forwardPopulation decreases 5% each year. Starts with a starting population of 3705. Find that population after 5 years.arrow_forwardsolve using substitution -2x-3y=-15 -3x+9y=12arrow_forward
- Suppose that 7000 is placed in an accout that pays 4% interest. Interest compunds each year. Assume that no withdraws are made. How much would the account have after 1 year? And how much would the account have after 2 years?arrow_forwardUse substitution to solve the equations -2x+5y=18 x=2y-8arrow_forward5) For each function represented by an equation, make a table and plot the corresponding points to sketch the graph of the function. (a) y = 75 ()* 220 X y 200- -2 180 160 -1 140 0 120 100 1 60 80 2 3 4 x (b) y = 20 ()* 1 60 40 20 20 0 2 3 65- -1 X y 60 -2 55- 50 45 44 40 0 35- 30 1 25 2 20 20 15 3 10 5 LO 4 3-2 T -1 0 5- 4- -3- 2-arrow_forward
- A system of inequalities is shown. y 5 3 2 1 X -5 -4 -3 -2 -1 0 1 2 3 4 5 -1- Which system is represented in the graph? Oy>-x²-x+1 y 2x²+3 -2 -3 тarrow_forwardWhich set of systems of equations represents the solution to the graph? -5 -4 -3 -2 Of(x) = x² + 2x + 1 g(x) = x²+1 f(x) = x²+2x+1 g(x) = x²-1 f(x) = −x² + 2x + 1 g(x) = x²+1 f(x) = x² + 2x + 1 g(x) = x²-1 -1 5 y 4 3 2 1 0 -1- -2 -3- -4. -5 1 2 3 4 5arrow_forwardWhich of the graphs below correctly solves for x in the equation -x² - 3x-1=-x-4? о 10 8 (0,2) -10 -8 -6 -2 2 4 6 8 10 (-4,-2) -2 + (0,2) (4,6) -10-8-6-4-2 -2 2 4 6 8 10 (-3, -1) -2 2 (1-5) -6 -8 -10 10 -10-8-6-4-2 2 6 8 10 (2,0)arrow_forward
- 1) Express these large and small numbers from the Read and Study section in scientific notation: (a) 239,000 miles (b) 3,800,000,000,000 sheets of paper (c) 0.0000000000000000000000167 grams 2) Find all values for the variable x that make these equations true. (a) 5x = 1 (b) 3x = 1/1 9 (c) 4* = 11/ 4 (e) 4* = 64 (g) 10x = 1,000,000 (d) 3x=-3 (f) 2x = = 8 (h) 10x = 0.001arrow_forward(b) 4) Find an equation to fit each of the following graphs: (a) 20 20 18 16 14 12 10 8 6 4 2 24 22 20 18 16 14 12 10 8 16 A 2 -3 -2 -1-0 2 3 4. -1 0 1 2 3. -2 -2arrow_forward3) Which of the following are equivalent to 3? (There may be more than one that is equivalent!) -1 (a) (9)¯¹ 3. (b) (-3)-1 (c) (-3) -1 (d) -(¯3) (e) 11 3-1 (f) 3-4arrow_forward
 Glencoe Algebra 1, Student Edition, 9780079039897...AlgebraISBN:9780079039897Author:CarterPublisher:McGraw Hill