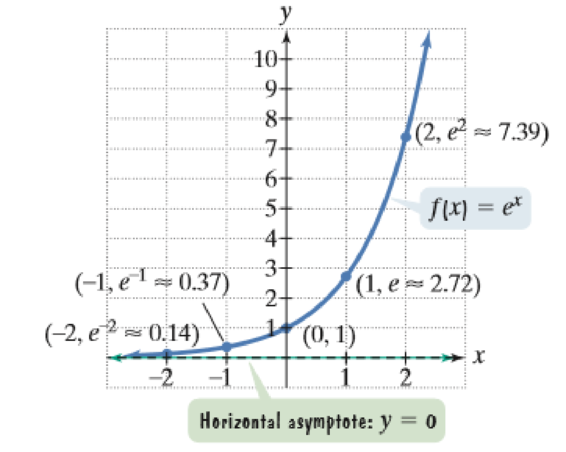
The figure shows the graph of f ( x ) = e x . In Exercises 35–46, use transformations of this graph to graph each function. Be sure to give equations of the asymptotes. Use the graphs to determine each function’s domain and range. If applicable, use a graphing utility to confirm your hand-drawn graphs. 39. h ( x ) = e x − 1 + 2
The figure shows the graph of f ( x ) = e x . In Exercises 35–46, use transformations of this graph to graph each function. Be sure to give equations of the asymptotes. Use the graphs to determine each function’s domain and range. If applicable, use a graphing utility to confirm your hand-drawn graphs. 39. h ( x ) = e x − 1 + 2
Solution Summary: The author illustrates the graph of the function h(x)=ex-1+2 by using transformations and to find the asymptotes.
The figure shows the graph of
f
(
x
)
=
e
x
. In Exercises 35–46, use transformations of this graph to graph each function. Be sure to give equations of the asymptotes. Use the graphs to determine each function’s domain and range. If applicable, use a graphing utility to confirm your hand-drawn graphs.
Need a deep-dive on the concept behind this application? Look no further. Learn more about this topic, algebra and related others by exploring similar questions and additional content below.


 Algebra & Trigonometry with Analytic GeometryAlgebraISBN:9781133382119Author:SwokowskiPublisher:Cengage