
Concept explainers
Videos
(a)
The
(a)
Answer to Problem 23P
Solution: The provided values, that is,
Explanation of Solution
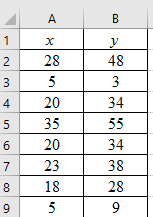
Given: The provided table consists of values of x and y, where x represents the average annual hours spent by a person in traffic delay, y represents the average annual gallons of fuel wasted per person due to traffic delay. The data consists of 8 data pairs, thus n is 8.
Calculation: Follow the steps given below in MS Excel to obtain the scatter plot of the data.
Step 1: Enter the data into an MS Excel sheet. The screenshot is given below.
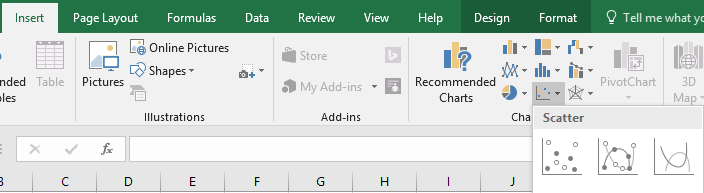
Step 2: Select the data and click on ‘Insert’. Go to charts and select the chart type ‘Scatter’.
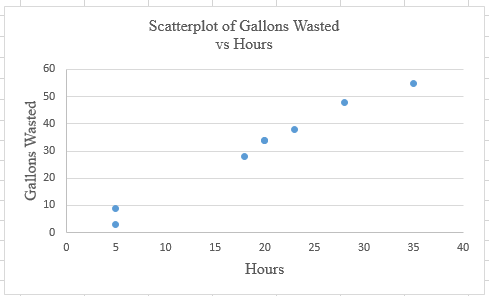
Step 3: Select the first plot and then click ‘add chart element’ provided in the left corner of the menu bar. Insert the ‘Axis titles’ and ‘Chart title’. The scatter plot for the provided data is shown below:
To calculate
| 28 | 48 | 784 | 2304 | 1344 |
| 5 | 3 | 25 | 9 | 15 |
| 20 | 34 | 400 | 1156 | 680 |
| 35 | 55 | 1225 | 3025 | 1925 |
| 20 | 34 | 400 | 1156 | 680 |
| 23 | 38 | 529 | 1444 | 874 |
| 18 | 28 | 324 | 784 | 504 |
| 5 | 9 | 25 | 81 | 45 |
The provided values,
Now, the value of
Substituting the values in the above formula. Thus:
Therefore, the correlation coefficient is 0.991.
(b)
The averages
(b)
Answer to Problem 23P
Solution: The values for data set 1 are
The values for data set 2 are
Explanation of Solution
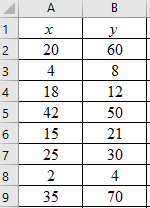
Given: The provided table consists of values of x and y, where x represents the average annual hours spent by a person in traffic delay, y represents the average annual gallons of fuel wasted per person due to traffic delay.
The second table consists of x and y values where, x represent the annual hours lost by a person spent in traffic delay, y represents the annual gallons of fuel wasted by that person in traffic delay.
The data sets consist of 8 data pairs, thus n is 8 for both the data sets.
The provided values of data set 1 are,
The provided values of data set 2 are,
Calculation:
The value of
The value of
The standard deviation of x for data set 1 can be calculated as,
The standard deviation of
The value of
The value of
The standard deviation of
The standard deviation of
For the second data set, that is, for the variables based on single individuals, the standard deviations
The values
(c)
The scatter plot, whether the provided values of
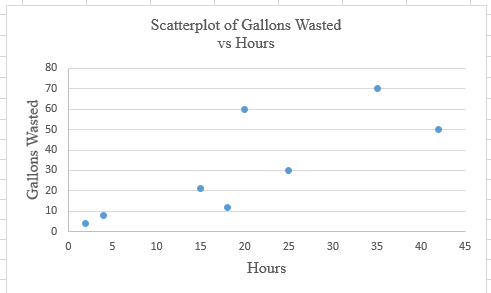
(c)
Answer to Problem 23P
Solution: The provided values, that is,
Explanation of Solution
The provided table consists of values of x and y, where x represents the average annual hours spent by a person in traffic delay, y represents the average annual gallons of fuel wasted per person due to traffic delay.
The data sets consist of 8 data pairs, thus n is 8.
Calculation: Follow the steps given below in MS Excel to obtain the scatter plot of the data.
Step 1: Enter the data into an MS Excel sheet. The screenshot is given below.
Step 2: Select the data and click on ‘Insert’. Go to charts and select the chart type ‘Scatter’.
Step 3: Select the first plot and then click ‘add chart element’ provided in the left corner of the menu bar. Insert the ‘Axis titles’ and ‘Chart title’. The scatter plot for the provided data is shown below:
Calculation: The calculation for
| 20 | 60 | 400 | 3600 | 1200 |
| 4 | 8 | 16 | 64 | 32 |
| 18 | 12 | 324 | 144 | 216 |
| 42 | 50 | 1764 | 2500 | 2100 |
| 15 | 21 | 225 | 441 | 315 |
| 25 | 30 | 625 | 900 | 750 |
| 2 | 4 | 4 | 16 | 8 |
| 35 | 70 | 1225 | 4900 | 2450 |
The provided values,
Now, the value of
Substituting the values in the above formula. Thus:
Therefore, the correlation coefficient is 0.794.
(d)
Comparison between the values of r that are calculated in part (a) and part (c), whether the data for average have a higher correlation coefficient than the data for individual measurement or not, and the reason for it.
(d)
Answer to Problem 23P
Solution: Yes, the data for average has a higher correlation coefficient than the data for individual measurement because, according to the central limit theorem, the standard deviation of averages will be smaller than the standard deviation of individual values.
Explanation of Solution
Given: The values of correlation coefficient from part (a) and part (b) are 0.991 and 0.794, respectively.
It can be seen that
According to the central limit theorem, the standard deviation is smaller for the
Want to see more full solutions like this?
Chapter 4 Solutions
UNDERSTANDING BASIC STAT LL BUND >A< F


- According to flightstats.com, American Airlines flights from Dallas to Chicago are on time 80% of the time. Suppose 10 flights are randomly selected, and the number of on-time flights is recorded. (a) Explain why this is a binomial experiment. (b) Determine the values of n and p. (c) Find and interpret the probability that exactly 6 flights are on time. (d) Find and interpret the probability that fewer than 6 flights are on time. (e) Find and interpret the probability that at least 6 flights are on time. (f) Find and interpret the probability that between 4 and 6 flights, inclusive, are on time.arrow_forwardShow how you get critical values of 1.65, -1.65, and $1.96 for a right-tailed, left- tailed, and two-tailed hypothesis test (use a = 0.05 and assume a large sample size).arrow_forwardSuppose that a sports reporter claims the average football game lasts 3 hours, and you believe it's more than that. Your random sample of 35 games has an average time of 3.25 hours. Assume that the population standard deviation is 1 hour. Use a = 0.05. What do you conclude?arrow_forward
- Suppose that a pizza place claims its average pizza delivery time is 30 minutes, but you believe it takes longer than that. Your sample of 10 pizzas has an average delivery time of 40 minutes. Assume that the population standard deviation is 15 minutes and the times have a normal distribution. Use a = 0.05. a. What are your null and alternative hypotheses? b. What is the critical value? c. What is the test statistic? d. What is the conclusion?arrow_forwardTable 5: Measurement Data for Question 9 Part Number Op-1, M-1 Op-1, M-2 | Op-2, M-1 Op-2, M-2 | Op-3, M-1 Op-3, M-2 1 21 20 20 20 19 21 2 24 23 24 24 23 24 3 4 5 6 7 8 9 10 11 21 12 8222332 201 21 20 22 20 22 27 27 28 26 27 28 19 18 19 21 24 21 22 19 17 18 24 23 25 25 23 26 20 20 18 19 17 13 23 25 25 2 3 3 3 3 2 3 18 18 21 21 23 22 24 22 20 19 23 24 25 24 20 21 19 18 25 25 14 24 24 23 25 24 15 29 30 30 28 31 16 26 26 25 26 25 17 20 20 19 20 20 843882388 20 18 25 20 19 25 25 30 27 20 18 19 21 19 19 21 23 19 25 26 25 24 25 25 20 19 19 18 17 19 17 Question 9 A measurement systems experiment involving 20 parts, three operators (Op-1, Op-2, Op-3), and two measure- ments (M-1, M-2) per part is shown in Table 5. (a) Estimate the repeatability and reproducibility of the gauge. (b) What is the estimate of total gauge variability?" (c) If the product specifications are at LSL = 6 and USL 60, what can you say about gauge capability?arrow_forwardQuestion 5 A fraction nonconforming control chart with center line 0.10, UCL = 0.19, and LCL = 0.01 is used to control a process. (a) If three-sigma limits are used, find the sample size for the control charte 2 (b) Use the Poisson approximation to the binomial to find the probability of type I error. (c) Use the Poisson approximation to the binomial to find the probability of type II error if the process fraction defective is actually p = 0.20.arrow_forward
- Question 8 Ten parts are measured three times by the same operator in a gauge capability study. The data are shown in Table 4. (a) Describe the measurement error that results from the use of this gauge. I (b) Estimate total variability and product variability. (c) What percentage of total variability is due to the gauge? (d) If specifications on the part are at 100±15, find the P/T ratio for this gauge. Comment on the adequacy of the gauge. 3 Table 4: Measurement Data for Question 8 Part Number Measurement 1 Measurement 2 Measurement 3 1 2 100 95 101 100 93 97 3 101 103 100 4 96 95 97 5 98 98 96 6 99 98 98 7889 95 97 98 100 99 98 100 100 97 10 100 98 98 99arrow_forwardQuestion 6 The data shown in Table 3 are and R values for 24 samples of size n = 5 taken from a process producing bearings. The measurements are made on the inside diameter of the bearing, with only the last three decimals recorded (i.e., 34.5 should be 0.50345). Perform a process capability analysis using and R charts for the data from Table 3. Table 3: Data for Question 6 Sample Number R | Sample Number I Ꭱ 1 34.5 3 13 35.4 8 2 34.2 4 14 34.0 6 ∞∞ 31.6 15 37.1 5 4 31.5 4 16 34.9 7 56789 35.0 5 17 33.5 4 34.1 6 18 31.7 3 32.6 4 19 34.0 8 33.8 3 20 35.1 4 34.8 7 10 33.6 8 11 31.9 3 12 38.6 9 2232 21 33.7 2 32.8 1 33.5 24 34.2 2 32 3arrow_forwardQuestion 1 The commercial loan operation of a financial institution has a standard for processing new loan applications in 24 hours. Table 1 shows the number of applications processed each day for the last 20 days and the number of applications that required more than 24 hours to complete. Table 1: Loan Application Data for Question 1 Day Applications Late Day Applications Late 1 200 3 11 219 0 2 250 4 12 238 10 3 240 2 13 250 4 4 300 5 14 302 6 5 200 2 15 219 20 6 250 4 16 246 3 7 246 3 17 251 6 8 258 5 18 273 7 9 275 2 19 245 3 10 274 1 20 260 (a) Set up the fraction nonconforming control chart for this process. Use the variable-width control limit approach. Plot the preliminary data in Table 1 on the chart. Is the process in statistical control? (b) Assume that assignable causes can be found for any out-of-control points on this chart. What center line should be used for process monitoring in the next period, and how should the control limits be calculated?arrow_forward
- help me with ab please. please handwrite if possible. please don't use AI tools to answerarrow_forwardhelp me with ab please. please handwrite if possible. please don't use AI tools to answerarrow_forwardhelp me with abcd please. please handwrite if possible. please don't use AI tools to answerarrow_forward
 Holt Mcdougal Larson Pre-algebra: Student Edition...AlgebraISBN:9780547587776Author:HOLT MCDOUGALPublisher:HOLT MCDOUGAL
 Glencoe Algebra 1, Student Edition, 9780079039897...AlgebraISBN:9780079039897Author:CarterPublisher:McGraw Hill
 Big Ideas Math A Bridge To Success Algebra 1: Stu...AlgebraISBN:9781680331141Author:HOUGHTON MIFFLIN HARCOURTPublisher:Houghton Mifflin Harcourt