
Elementary Statistics Plus MyLab Statistics with Pearson eText -- Access Card Package (7th Edition) (What's New in Statistics)
7th Edition
ISBN: 9780134684901
Author: Ron Larson, Betsy Farber
Publisher: PEARSON
expand_more
expand_more
format_list_bulleted
Concept explainers
Videos
Textbook Question
thumb_up100%
Chapter 4.1, Problem 22E
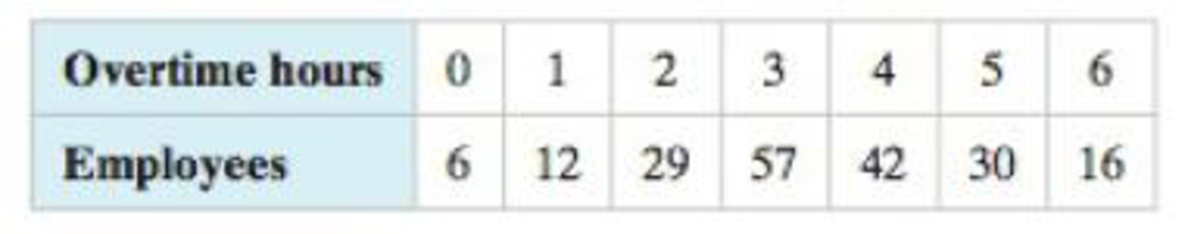
Finding Probabilities Use the
20. Overtime Hours The number of overtime hours worked in one week per employee
Expert Solution & Answer
Want to see the full answer?
Check out a sample textbook solution
Students have asked these similar questions
We consider a one-period market with the following properties: the current stock priceis S0 = 4. At time T = 1 year, the stock has either moved up to S1 = 8 (with probability0.7) or down towards S1 = 2 (with probability 0.3). We consider a call option on thisstock with maturity T = 1 and strike price K = 5. The interest rate on the money marketis 25% yearly.(a) Find the replicating portfolio (φ, ψ) corresponding to this call option.(b) Find the risk-neutral (no-arbitrage) price of this call option.(c) We now consider a put option with maturity T = 1 and strike price K = 3 onthe same market. Find the risk-neutral price of this put option. Reminder: A putoption gives you the right to sell the stock for the strike price K.1(d) An investor with initial capital X0 = 0 wants to invest on this market. He buysα shares of the stock (or sells them if α is negative) and buys β call options (orsells them is β is negative). He invests the cash balance on the money market (orborrows if the amount is…
Determine if the two statements are equivalent using a truth table
Question 4: Determine if pair of statements A and B are equivalent or not, using truth table.
A. (~qp)^~q
в. р л~9
Chapter 4 Solutions
Elementary Statistics Plus MyLab Statistics with Pearson eText -- Access Card Package (7th Edition) (What's New in Statistics)
Ch. 4.1 - Determine whether each random variable x is...Ch. 4.1 - A company tracks the number of sales new employees...Ch. 4.1 - Verify that the distribution you constructed in...Ch. 4.1 - Determine whether each distribution is a...Ch. 4.1 - Find the mean of the probability distribution you...Ch. 4.1 - Find the variance and standard deviation of the...Ch. 4.1 - At a raffle, 2000 tickets are sold at 5 each for...Ch. 4.1 - What is a random variable? Give an example of a...Ch. 4.1 - What is a discrete probability distribution? What...Ch. 4.1 - Is the expected value of the probability...
Ch. 4.1 - What does the mean of a probability distribution...Ch. 4.1 - True or False? In Exercises 58, determine whether...Ch. 4.1 - True or False? In Exercises 58, determine whether...Ch. 4.1 - True or False? In Exercises 58, determine whether...Ch. 4.1 - True or False? In Exercises 58, determine whether...Ch. 4.1 - Graphical Analysis In Exercises 912, determine...Ch. 4.1 - Graphical Analysis In Exercises 912, determine...Ch. 4.1 - Graphical Analysis In Exercises 912, determine...Ch. 4.1 - Graphical Analysis In Exercises 912, determine...Ch. 4.1 - Discrete Variables and Continuous Variables In...Ch. 4.1 - Discrete Variables and Continuous Variables In...Ch. 4.1 - Discrete Variables and Continuous Variables In...Ch. 4.1 - Discrete Variables and Continuous Variables In...Ch. 4.1 - Discrete Variables and Continuous Variables In...Ch. 4.1 - Discrete Variables and Continuous Variables In...Ch. 4.1 - Constructing and Graphing Discrete Probability...Ch. 4.1 - Constructing and Graphing Discrete Probability...Ch. 4.1 - Finding Probabilities Use the probability...Ch. 4.1 - Finding Probabilities Use the probability...Ch. 4.1 - Unusual Events In Exercise 19, would it be unusual...Ch. 4.1 - Unusual Events In Exercise 20, would it be unusual...Ch. 4.1 - Determining a Missing Probability In Exercises 25...Ch. 4.1 - Determining a Missing Probability In Exercises 25...Ch. 4.1 - Identifying Probability Distributions In Exercises...Ch. 4.1 - Identifying Probability Distributions In Exercises...Ch. 4.1 - Finding the Mean, Variance, and Standard Deviation...Ch. 4.1 - Baseball The number of games played in each World...Ch. 4.1 - Finding the Mean, Variance, and Standard Deviation...Ch. 4.1 - Finding the Mean, Variance, and Standard Deviation...Ch. 4.1 - Hurricanes The histogram shows the distribution of...Ch. 4.1 - Reviewer Ratings The histogram shows the reviewer...Ch. 4.1 - Writing The expected value of an accountants...Ch. 4.1 - Writing In a game of chance, what is the...Ch. 4.1 - Finding an Expected Value In Exercises 37and 38,...Ch. 4.1 - A high school basketball team is selling 10 raffle...Ch. 4.1 - Linear Transformation of a Random Variable In...Ch. 4.1 - Prob. 40ECh. 4.1 - What is the average sum of their scores? What is...Ch. 4.1 - What is the standard deviation of the difference...Ch. 4.2 - Determine whether the experiment is a binomial...Ch. 4.2 - A card is selected from a standard deck and...Ch. 4.2 - A survey found that 52% of U.S. adults associate...Ch. 4.2 - The survey in Example 5 found that 27% of U.S....Ch. 4.2 - About 5% of workers (ages 16 years and older) in...Ch. 4.2 - A recent study found that 28% of U.S. adults read...Ch. 4.2 - In San Francisco, California, about 44% of the...Ch. 4.2 - In a binomial experiment, what does it mean to say...Ch. 4.2 - In a binomial experiment with n trials, what does...Ch. 4.2 - Graphical Analysis In Exercises 35, the histogram...Ch. 4.2 - Graphical Analysis In Exercises 35, the histogram...Ch. 4.2 - Graphical Analysis In Exercises 35, the histogram...Ch. 4.2 - Graphical Analysis In Exercises 68, the histogram...Ch. 4.2 - Graphical Analysis In Exercises 68, the histogram...Ch. 4.2 - Graphical Analysis In Exercises 68, the histogram...Ch. 4.2 - Identify the unusual values of x in each histogram...Ch. 4.2 - Identify the unusual values of x in each histogram...Ch. 4.2 - Mean, Variance, and Standard Deviation In...Ch. 4.2 - Mean, Variance, and Standard Deviation In...Ch. 4.2 - Mean, Variance, and Standard Deviation In...Ch. 4.2 - Mean, Variance, and Standard Deviation In...Ch. 4.2 - Identifying and Understanding Binomial Experiments...Ch. 4.2 - Identifying and Understanding Binomial Experiments...Ch. 4.2 - Identifying and Understanding Binomial Experiments...Ch. 4.2 - Identifying and Understanding Binomial Experiments...Ch. 4.2 - Finding Binomial Probabilities In Exercises 1926,...Ch. 4.2 - Finding Binomial Probabilities In Exercises 1926,...Ch. 4.2 - Finding Binomial Probabilities In Exercises 1926,...Ch. 4.2 - Finding Binomial Probabilities In Exercises 1926,...Ch. 4.2 - Finding Binomial Probabilities In Exercises 1926,...Ch. 4.2 - Finding Binomial Probabilities In Exercises 1926,...Ch. 4.2 - Finding Binomial Probabilities In Exercises 1926,...Ch. 4.2 - Finding Binomial Probabilities In Exercises 1926,...Ch. 4.2 - Constructing and Graphing Binomial Distributions...Ch. 4.2 - Constructing and Graphing Binomial Distributions...Ch. 4.2 - Constructing and Graphing Binomial Distributions...Ch. 4.2 - Constructing and Graphing Binomial Distributions...Ch. 4.2 - Finding and Interpreting Mean, Variance, and...Ch. 4.2 - Finding and Interpreting Mean, Variance, and...Ch. 4.2 - Finding and Interpreting Mean, Variance, and...Ch. 4.2 - Finding and Interpreting Mean, Variance, and...Ch. 4.2 - Finding and Interpreting Mean, Variance, and...Ch. 4.2 - Finding and Interpreting Mean, Variance, and...Ch. 4.2 - Genetics According to a theory in genetics, when...Ch. 4.2 - Genetics Another proposed theory in genetics gives...Ch. 4.2 - Manufacturing An assembly line produces 10,000...Ch. 4.2 - Prob. 1ACh. 4.2 - Prob. 2ACh. 4.2 - For the election in Exercise 1, simulate selecting...Ch. 4.2 - 1. Construct a probability distribution for the...Ch. 4.2 - 2. Construct binomial probability distributions...Ch. 4.2 - 3. Compare your distributions from Exercise 1 and...Ch. 4.2 - 4. During the 2016 regular season, Kris Bryant of...Ch. 4.3 - The study in Example 1 found that the smartphones...Ch. 4.3 - What is the probability that more than four...Ch. 4.3 - Two thousand brown trout are introduced into a...Ch. 4.3 - In Exercises 14, find the indicated probability...Ch. 4.3 - Prob. 2ECh. 4.3 - In Exercises 14, find the indicated probability...Ch. 4.3 - Prob. 4ECh. 4.3 - In Exercises 58, find the indicated probability...Ch. 4.3 - Prob. 6ECh. 4.3 - In Exercises 58, find the indicated probability...Ch. 4.3 - In Exercises 58, find the indicated probability...Ch. 4.3 - Prob. 9ECh. 4.3 - In your own words, describe the difference between...Ch. 4.3 - Prob. 11ECh. 4.3 - Using a Distribution to Find Probabilities In...Ch. 4.3 - Using a Distribution to Find Probabilities In...Ch. 4.3 - Using a Distribution to Find Probabilities In...Ch. 4.3 - Using a Distribution to Find Probabilities In...Ch. 4.3 - Using a Distribution to Find Probabilities In...Ch. 4.3 - Using a Distribution to Find Probabilities In...Ch. 4.3 - Using a Distribution to Find Probabilities In...Ch. 4.3 - Using a Distribution to Find Probabilities In...Ch. 4.3 - Using a Distribution to Find Probabilities In...Ch. 4.3 - Using a Distribution to Find Probabilities In...Ch. 4.3 - Using a Distribution to Find Probabilities In...Ch. 4.3 - Using a Distribution to Find Probabilities In...Ch. 4.3 - Using a Distribution to Find Probabilities In...Ch. 4.3 - Using a Distribution to Find Probabilities In...Ch. 4.3 - Using a Distribution to Find Probabilities In...Ch. 4.3 - Comparing Binomial and Poisson Distributions An...Ch. 4.3 - Hypergeometric Distribution Binomial experiments...Ch. 4.3 - Geometric Distribution: Mean and Variance In...Ch. 4.3 - Geometric Distribution: Mean and Variance In...Ch. 4.3 - Prob. 31ECh. 4.3 - Geometric Distribution: Mean and Variance In...Ch. 4 - In Exercises 13, assume the fire department...Ch. 4 - In Exercises 13, assume the fire department...Ch. 4 - In Exercises 13, assume the fire department...Ch. 4 - In Exercises 1 and 2, determine whether the random...Ch. 4 - In Exercises 1 and 2, determine whether the random...Ch. 4 - In Exercises 3 and 4, (a) construct a probability...Ch. 4 - In Exercises 3 and 4, (a) construct a probability...Ch. 4 - In Exercises 5 and 6, determine whether the...Ch. 4 - In Exercises 5 and 6, determine whether the...Ch. 4 - In Exercises 7 and 8, (a) find the mean, variance,...Ch. 4 - In Exercises 7 and 8, (a) find the mean, variance,...Ch. 4 - In Exercises 9 and 10, find the expected net gain...Ch. 4 - In Exercises 9 and 10, find the expected net gain...Ch. 4 - In Exercises 11 and 12, determine whether the...Ch. 4 - In Exercises 11 and 12, determine whether the...Ch. 4 - In Exercises 1316, find the indicated binomial...Ch. 4 - In Exercises 1316, find the indicated binomial...Ch. 4 - In Exercises 1316, find the indicated binomial...Ch. 4 - In Exercises 1316, find the indicated binomial...Ch. 4 - In Exercises 17 and 18, (a) construct a binomial...Ch. 4 - In Exercises 17 and 18, (a) construct a binomial...Ch. 4 - In Exercises 19 and 20, find the mean, variance,...Ch. 4 - In Exercises 19 and 20, find the mean, variance,...Ch. 4 - In Exercises 2126, find the indicated...Ch. 4 - Prob. 4.3.22RECh. 4 - In Exercises 2126, find the indicated...Ch. 4 - Prob. 4.3.24RECh. 4 - Prob. 4.3.25RECh. 4 - In Exercises 2126, find the indicated...Ch. 4 - Determine whether the random variable x is...Ch. 4 - The table lists the number of wireless devices per...Ch. 4 - Prob. 3CQCh. 4 - The five-year success rate of kidney transplant...Ch. 4 - An online magazine finds that the mean number of...Ch. 4 - Basketball player Dwight Howard makes a free throw...Ch. 4 - Which event(s) in Exercise 6 can be considered...Ch. 4 - In Exercises 13find the indicated probabilities...Ch. 4 - In Exercises 13, find the indicated probabilities...Ch. 4 - In Exercises 13find the indicated probabilities...Ch. 4 - Determine whether the distribution is a...Ch. 4 - The table shows the ages of students in a freshman...Ch. 4 - Seventy-seven percent of U.S. college students pay...Ch. 4 - The Centers for Disease Control and Prevention...Ch. 4 - The Centers for Disease Control and Prevention...Ch. 4 - Suspicious Samples? A lab worker tells you that...Ch. 4 - In Exercises 17, consider a grocery store that can...Ch. 4 - In Exercises 17, consider a grocery store that can...Ch. 4 - Prob. 3TCh. 4 - Prob. 4TCh. 4 - Prob. 5TCh. 4 - In Exercises 17, consider a grocery store that can...Ch. 4 - In Exercises 17, consider a grocery store that can...
Knowledge Booster


Learn more about
Need a deep-dive on the concept behind this application? Look no further. Learn more about this topic, statistics and related others by exploring similar questions and additional content below.Similar questions
- Determine if the two statements are equalivalent using a truth tablearrow_forwardQuestion 3: p and q represent the following simple statements. p: Calgary is the capital of Alberta. A) Determine the value of each simple statement p and q. B) Then, without truth table, determine the va q: Alberta is a province of Canada. for each following compound statement below. pvq р^~q ~рл~q ~q→ p ~P~q Pq b~ (d~ ← b~) d~ (b~ v d) 0 4arrow_forward2. Let X be a random variable. (a) Show that, if E X2 = 1 and E X4arrow_forward1. Show that, for any non-negative random variable X, EX+E+≥2, X E max X. 21.arrow_forwarda small pond contains eight catfish and six bluegill. If seven fish are caught at random, what is the probability that exactly five catfish have been caught?arrow_forward23 The line graph in the following figure shows Revenue ($ millions) one company's revenues over time. Explain why this graph is misleading and what you can do to fix the problem. 700 60- 50- 40 30 Line Graph of Revenue 20- 101 1950 1970 1975 1980 1985 Year 1990 2000arrow_forwardd of the 20 respectively. Interpret the shape, center and spread of the following box plot. 14 13 12 11 10 6 T 89 7 9 5. 治arrow_forwardF Make a box plot from the five-number summary: 100, 105, 120, 135, 140. harrow_forward14 Is the standard deviation affected by skewed data? If so, how? foldarrow_forwardFrequency 15 Suppose that your friend believes his gambling partner plays with a loaded die (not fair). He shows you a graph of the outcomes of the games played with this die (see the following figure). Based on this graph, do you agree with this person? Why or why not? 65 Single Die Outcomes: Graph 1 60 55 50 45 40 1 2 3 4 Outcome 55 6arrow_forwardlie y H 16 The first month's telephone bills for new customers of a certain phone company are shown in the following figure. The histogram showing the bills is misleading, however. Explain why, and suggest a solution. Frequency 140 120 100 80 60 40 20 0 0 20 40 60 80 Telephone Bill ($) 100 120arrow_forward25 ptical rule applies because t Does the empirical rule apply to the data set shown in the following figure? Explain. 2 6 5 Frequency 3 сл 2 1 0 2 4 6 8 00arrow_forwardarrow_back_iosSEE MORE QUESTIONSarrow_forward_ios
Recommended textbooks for you
 College AlgebraAlgebraISBN:9781305115545Author:James Stewart, Lothar Redlin, Saleem WatsonPublisher:Cengage Learning
 Algebra and Trigonometry (MindTap Course List)AlgebraISBN:9781305071742Author:James Stewart, Lothar Redlin, Saleem WatsonPublisher:Cengage Learning
 Algebra & Trigonometry with Analytic GeometryAlgebraISBN:9781133382119Author:SwokowskiPublisher:Cengage
 Holt Mcdougal Larson Pre-algebra: Student Edition...AlgebraISBN:9780547587776Author:HOLT MCDOUGALPublisher:HOLT MCDOUGAL
 College Algebra (MindTap Course List)AlgebraISBN:9781305652231Author:R. David Gustafson, Jeff HughesPublisher:Cengage Learning
College Algebra
Algebra
ISBN:9781305115545
Author:James Stewart, Lothar Redlin, Saleem Watson
Publisher:Cengage Learning
Algebra and Trigonometry (MindTap Course List)
Algebra
ISBN:9781305071742
Author:James Stewart, Lothar Redlin, Saleem Watson
Publisher:Cengage Learning
Algebra & Trigonometry with Analytic Geometry
Algebra
ISBN:9781133382119
Author:Swokowski
Publisher:Cengage
Holt Mcdougal Larson Pre-algebra: Student Edition...
Algebra
ISBN:9780547587776
Author:HOLT MCDOUGAL
Publisher:HOLT MCDOUGAL
College Algebra (MindTap Course List)
Algebra
ISBN:9781305652231
Author:R. David Gustafson, Jeff Hughes
Publisher:Cengage Learning
Mod-01 Lec-01 Discrete probability distributions (Part 1); Author: nptelhrd;https://www.youtube.com/watch?v=6x1pL9Yov1k;License: Standard YouTube License, CC-BY
Discrete Probability Distributions; Author: Learn Something;https://www.youtube.com/watch?v=m9U4UelWLFs;License: Standard YouTube License, CC-BY
Probability Distribution Functions (PMF, PDF, CDF); Author: zedstatistics;https://www.youtube.com/watch?v=YXLVjCKVP7U;License: Standard YouTube License, CC-BY
Discrete Distributions: Binomial, Poisson and Hypergeometric | Statistics for Data Science; Author: Dr. Bharatendra Rai;https://www.youtube.com/watch?v=lHhyy4JMigg;License: Standard Youtube License