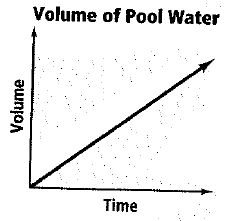
What are the variables in each graph? Describe how the variables are related at various points on the graph.

To define the variables in given graph and describe the relation of variables at various points on the graph.
Answer to Problem 1P
Variables are volume and time.
As time increases the Volume also increases.
Explanation of Solution
Given information: We have a given graph:

Calculation:
The horizontal axis is labeled as Time. So the independent variable is Time.
The vertical axis is labeled as Volume. So the dependent variable is Volume.
Therefore, given graph is showing variables of Time and Volume.
Shown graph is a straight line that starts from origin (0,0). Volume is increasing at a constant rate.
As time increases the Volume also increases at a constant rate.
Chapter 4 Solutions
High School Math 2012 Common-core Algebra 1 Practice And Problem Solvingworkbook Grade 8/9
Additional Math Textbook Solutions
Elementary Statistics: Picturing the World (7th Edition)
Basic Business Statistics, Student Value Edition
Elementary Statistics (13th Edition)
Algebra and Trigonometry (6th Edition)
Thinking Mathematically (6th Edition)
Intro Stats, Books a la Carte Edition (5th Edition)
- Determine whether the inverse of f(x)=x^4+2 is a function. Then, find the inverse.arrow_forwardThe 173 acellus.com StudentFunctions inter ooks 24-25/08 R Mastery Connect ac ?ClassiD-952638111# Introduction - Surface Area of Composite Figures 3 cm 3 cm 8 cm 8 cm Find the surface area of the composite figure. 2 SA = [?] cm² 7 cm REMEMBER! Exclude areas where complex shapes touch. 7 cm 12 cm 10 cm might ©2003-2025 International Academy of Science. All Rights Reserved. Enterarrow_forwardYou are given a plane Π in R3 defined by two vectors, p1 and p2, and a subspace W in R3 spanned by twovectors, w1 and w2. Your task is to project the plane Π onto the subspace W.First, answer the question of what the projection matrix is that projects onto the subspace W and how toapply it to find the desired projection. Second, approach the task in a different way by using the Gram-Schmidtmethod to find an orthonormal basis for subspace W, before then using the resulting basis vectors for theprojection. Last, compare the results obtained from both methodsarrow_forward
- Plane II is spanned by the vectors: - (2) · P² - (4) P1=2 P21 3 Subspace W is spanned by the vectors: 2 W1 - (9) · 1 W2 1 = (³)arrow_forwardshow that v3 = (−√3, −3, 3)⊤ is an eigenvector of M3 . Also here find the correspondingeigenvalue λ3 . Just from looking at M3 and its components, can you say something about the remaining twoeigenvalues? If so, what would you say? find v42 so that v4 = ( 2/5, v42, 1)⊤ is an eigenvector of M4 with corresp. eigenvalue λ4 = 45arrow_forwardChapter 4 Quiz 2 As always, show your work. 1) FindΘgivencscΘ=1.045. 2) Find Θ given sec Θ = 4.213. 3) Find Θ given cot Θ = 0.579. Solve the following three right triangles. B 21.0 34.6° ca 52.5 4)c 26° 5) A b 6) B 84.0 a 42° barrow_forward
- Q1: A: Let M and N be two subspace of finite dimension linear space X, show that if M = N then dim M = dim N but the converse need not to be true. B: Let A and B two balanced subsets of a linear space X, show that whether An B and AUB are balanced sets or nor. Q2: Answer only two A:Let M be a subset of a linear space X, show that M is a hyperplane of X iff there exists ƒ€ X'/{0} and a € F such that M = (x = x/f&x) = x}. fe B:Show that every two norms on finite dimension linear space are equivalent C: Let f be a linear function from a normed space X in to a normed space Y, show that continuous at x, E X iff for any sequence (x) in X converge to Xo then the sequence (f(x)) converge to (f(x)) in Y. Q3: A:Let M be a closed subspace of a normed space X, constract a linear space X/M as normed space B: Let A be a finite dimension subspace of a Banach space X, show that A is closed. C: Show that every finite dimension normed space is Banach space.arrow_forward• Plane II is spanned by the vectors: P12 P2 = 1 • Subspace W is spanned by the vectors: W₁ = -- () · 2 1 W2 = 0arrow_forwardThree streams - Stream A, Stream B, and Stream C - flow into a lake. The flow rates of these streams are not yet known and thus to be found. The combined water inflow from the streams is 300 m³/h. The rate of Stream A is three times the combined rates of Stream B and Stream C. The rate of Stream B is 50 m³/h less than half of the difference between the rates of Stream A and Stream C. Find the flow rates of the three streams by setting up an equation system Ax = b and solving it for x. Provide the values of A and b. Assuming that you get to an upper-triangular matrix U using an elimination matrix E such that U = E A, provide also the components of E.arrow_forward
- dent Application X GA spinner is divided into five cox | + 9/26583471/4081d162951bfdf39e254aa2151384b7 A spinner is divided into five colored sections that are not of equal size: red, blue, green, yellow, and purple. The spinner is spun several times, and the results are recorded below: Spinner Results Color Frequency Red 5 Blue 11 Green 18 Yellow 5 Purple 7 Based on these results, express the probability that the next spin will land on purple as a fraction in simplest form. Answer Attempt 1 out of 2 Submit Answer 0 Feb 12 10:11 Oarrow_forward2 5x + 2–49 2 x+10x+21arrow_forward5x 2x+y+ 3x + 3y 4 6arrow_forward
 Algebra and Trigonometry (6th Edition)AlgebraISBN:9780134463216Author:Robert F. BlitzerPublisher:PEARSON
 Contemporary Abstract AlgebraAlgebraISBN:9781305657960Author:Joseph GallianPublisher:Cengage Learning
 Linear Algebra: A Modern IntroductionAlgebraISBN:9781285463247Author:David PoolePublisher:Cengage Learning
 Algebra And Trigonometry (11th Edition)AlgebraISBN:9780135163078Author:Michael SullivanPublisher:PEARSON
 Introduction to Linear Algebra, Fifth EditionAlgebraISBN:9780980232776Author:Gilbert StrangPublisher:Wellesley-Cambridge Press
 College Algebra (Collegiate Math)AlgebraISBN:9780077836344Author:Julie Miller, Donna GerkenPublisher:McGraw-Hill Education


