EBK ECONOMICS: PRINCIPLES AND POLICY
13th Edition
ISBN: 8220100605932
Author: Blinder
Publisher: Cengage Learning US
expand_more
expand_more
format_list_bulleted
Textbook Question
Chapter 4, Problem 4TY
The following table summarizes information about the market for principles of economics textbooks:
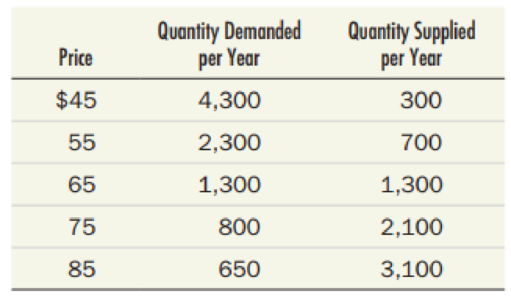
- a. What is the
market equilibrium price and quantity of textbooks? - b. To quell outrage over tuition increases, the college places a $55 limit on the price of textbooks. How many textbooks will be sold now?
- c. While the price limit is still in effect, automated publishing increases the efficiency of textbook production. Show graphically the likely effect of this innovation on the market price and quantity.
Expert Solution & Answer
Want to see the full answer?
Check out a sample textbook solutionStudents have asked these similar questions
The following table represents the market for solar wireless
keyboards. Plot this data on a supply and demand graph
and identify the equilibrium price and quantity. Explain
what would happen if the market price is set at $60, and
show this on the graph. Explain what would happen if the
market price is set at $30, and show this on the graph.
Price
$ 10.00
20.00
30.00
40.00
50.00
60.00
70.00
Quantity
Demanded
28
24
20
16
12
8
4
Quantity
Supplied
0
3
6
9
12
15
18
जी
Listed below are several items which would affect the market for personal computers. For each event, do the following: 1) Tell whether the event shifts
demand or supply, 2) tell whether the curve increases or decreases, and 3) report the predicted change in price and quantity of personal computers.
a) A fall in the price of software
b) A government subsidy to computer makers
c) A decrease in consumers' income due to a recession
d) An increase in the price of silicon (used in making all kinds of computer chips like CPU's, memory chips, etc.).
For each of the following events described, indicate the effects to the demand and to the supply. Use the
demand and supply graphs provided below to match these events. Then determine what happens to the
market equilibrium price and equilibrium quantity.
Scenario: Consider the market for potato, if potatoes are considered as
inferior good and income rises at the same time that low temperature kills
some potato buds.
Change in Demand *
Increase
Decrease
Did not Change
Indeterminate
Change in Supply *
Increase
Decrease
Did not Change
Indeterminate
Graph *
So
So
Do
Do
A
B
O A
O B
So
So
S1
Do
Do
D
D
So
So
Do
F
O E
F
S.
So
So
D:
Do
Do
G
G
H
So
So
D
Do
Do
D1
J
J
So
Do
D1
-Q
K
K
Change in market equilibrium price.
Increase
Decrease
Did not Change
Indeterminate
Change in market equilibrium quantity.
Increase
Decrease
Did not Change
Indeterminate
Chapter 4 Solutions
EBK ECONOMICS: PRINCIPLES AND POLICY
Knowledge Booster
Learn more about
Need a deep-dive on the concept behind this application? Look no further. Learn more about this topic, economics and related others by exploring similar questions and additional content below.Similar questions
- The following table summarizes information about the market for principles of economics textbooks: What is the market equilibrium price and quantity of textbooks? To quell outrage over tuition increases, the college places a $55 limit on the price of textbooks. How many textbooks will be sold now? While the price limit is still in effect, automated publishing increases the efficiency of textbook production. Show graphically the likely effect of this innovation on the market price and quantity.arrow_forwardThe following table summarizes information about the market for principles of economics textbooks: Price Quantity Demanded per Year Quantity Supplied per Year $45 4,300 300 55 2,300 700 65 1,300 1,300 75 800 2,100 85 650 3,100 What is the market equilibrium price and quantity of textbooks? To quell outrage over tuition increases, the college places a $55 limit on the price of textbooks. How many textbooks will be sold now? While the price limit is still in effect, automated publishing increases the efficiency of textbook production. Show graphically the likely effect of this innovation on the market price and quantity.arrow_forwardThe table below shows the monthly demand and supply of gallons of Ghana Nuts Oil at different prices. Use the information in the table to answer the questions that follows: Price per gallon Quantity of gallons demanded Quantity of gallons Supplied 20 5000 1000 25 4000 2000 30 3000 3000 35 2000 4000 40 1000 5000 Use the information in the table to sketch the demand and supply curve on the same axis. (NOTE: Graph sheet is not needed). What is the equilibrium price and quantity? Which of the prices would cause shortages? Calculate the shortages that may occur at those prices. Suppose the Government of Ghana imposes a minimum price legislation which led to surpluses in the oil market, discuss two ways that can be use to address or mitigate the surpluses in the market. Suppose the price of Ghana Nut Oil increase from 20 to 25, calculate the price elasticity of demand and supply of Ghana Nut Oil. Demand and Supply which one is more…arrow_forward
- Need help with micro homeworkarrow_forwardThe demand and supply curves for T-shirts are given by the following equations, where P is the price and Q is the quantity. Demand: Q = 65000 – 50P Supply: Q – 5000 = 250P Find the equilibrium price and quantity.arrow_forwardFor each of the following events described, indicate the effects to the demand and to the supply. Use the demand and supply graphs provided below to match these events. Then determine what happens to the market equilibrium price and equilibrium quantity. Scenario: Before economic reforms were implemented in the countries of Eastern Europe, regulation held the price of bread substantially below equilibrium. When reforms were implemented, prices were deregulated and they rose dramatically. As a result, the quantity demanded for bread dramatically fell and the quantity supplied for supplied rose sharply. Change in Demand * Increase Decrease Did not Change Indeterminate Change in Supply * Increase Decrease Did not Change Indeterminate Graph * So D: Do Do A В O A В So So Do Do Q D O c O D P So So Do D- E F O E F P S. So So Do Do G H So P So D1 Do Do D1 Q -Q J J S: So Do O K Change in market equilibrium price. * Increase Decrease Did not Change O Indeterminate Change in market equilibrium…arrow_forward
- Consider a market for Ice Cream an inferior good in Pakistan. For each of the given events, identify which of the determinants of the demand or supply are affected. Also indicate whether demand or supply increase or decreases. Then draw a diagram to show the effect on the price and quantity of Ice Cream and solve all the subparts: News reports claim that the consumption of Ice Cream is good for the health of coronavirus patients. There has been a decline in wages of all employees in Pakistan due to the third wave of coronavirus. People in Pakistan decide to have more children. Students of NED University develop new automated machinery for the production of Ice Cream. There has been a decrease in people’s income due to COVID-19 crisis. i News reports claim that the consumption of Ice Cream is good for the health of coronavirus patients. identify which of the determinants of the demand or supply are affected. Also indicate whether demand or supply increase or decreases…arrow_forwardFor each of the following events described, indicate the effects to the demand and to the supply. Use the demand and supply graphs provided below to match these events. Then determine what happens to the market equilibrium price and equilibrium quantity. Scenario: As more and more people bought home computers during the 1990s, the demand for access to the World Wide Web and the Internet increased sharply. At same time, new companies like Earl's began to enter the internet-access market competing with older, more established services such as American Online. Despite a massive increase in demand, the price of access to the Web actually declined. Change in Demand* Increase Decrease Did not Change Indeterminate Change in Supply * Increase Decrease Did not Change Indeterminate Graph * Do Do A B A P So So Do Do So So S: Do E F E So So Di Do Do G O G Он So S1 So Do Do Q So Do D1 -Q K O K Change in market equilibrium price. * Increase O Decrease Did not Change O Indeterminate Change in market…arrow_forwardThe demand and supply schedules for gatorade is as follows: Price (Gallons) Quantity Supplied $90 888888 80 70 60 50 40 Quantity Demanded 20 88888 25 30 35 40 55 65 339*** 55 45 35 25 15 What is the equilibrium price of gatorade? What is the equilibrium quantity? The city of Fayetteville is worried about the effectiveness of gatorade in thirst quenching young adults. They set a price floor $20 above equilibrium. How much gatorade is sold? in? Thirsty young adults seekers protest to the decision so the city imposes a price calling $10 lower than the price floor from the previous question. How much gatorade is sold? What effect does this resultarrow_forward
- Answer the following questions The amount by which the quantity supplied of a product exceeds the quantity demanded at a specific price? It occurs when the market price is above the equilibrium price These are called products and services that are used together; when the price of one falls, the demand for the other increasesarrow_forwardDemand and supply often shift in the retail market for gasoline. Below are two demand curves and two supply curves for gallons of gasoline in the month of May in a small town in Maine. Some of the data are missing a. Use the following facts to fill in the missing data in the table. If demand is D1 and supply is S1, the equilibrium quantity is 7,000 gallons per month. When demand is D2 and supply is S1, the equilibrium price is $3.00 per gallon. When demand is D2 and supply is S1, there is an excess demand of 4,000 gallons per month at a price of $1.00 per gallon. If demand is D1 and supply is S2, the equilibrium quantity is 8,000 gallons per month. b. Compare two equilibriums. In the first, demand is D1 and supply is S1. In the second, demand is D1 and supply is S2. By how much does the equilibrium quantity change? By how much does the equilibrium price change? c. If supply falls from S2 to S1 while demand declines from D2 to D1, does the equilibrium price rise, fall, or stay the same?…arrow_forwardThe following table gives the demand and supply schedules for widgets. Price {:[" Quantity "],[" Demanded "]:} Quantity Supplied $25 88 130 $20 92 120 $15 96 110 $10 100 100 $5 104 90 The equilibrium price in this market is $ The equilibrium quantity in this market is units. If the price in this market was $20, there would be a of units.arrow_forward
arrow_back_ios
SEE MORE QUESTIONS
arrow_forward_ios
Recommended textbooks for you
- Microeconomics: Principles & PolicyEconomicsISBN:9781337794992Author:William J. Baumol, Alan S. Blinder, John L. SolowPublisher:Cengage Learning
- Managerial Economics: A Problem Solving ApproachEconomicsISBN:9781337106665Author:Luke M. Froeb, Brian T. McCann, Michael R. Ward, Mike ShorPublisher:Cengage Learning
Microeconomics: Principles & Policy
Economics
ISBN:9781337794992
Author:William J. Baumol, Alan S. Blinder, John L. Solow
Publisher:Cengage Learning
Managerial Economics: A Problem Solving Approach
Economics
ISBN:9781337106665
Author:Luke M. Froeb, Brian T. McCann, Michael R. Ward, Mike Shor
Publisher:Cengage Learning
What is Efficiency?; Author: Marketing Business Network;https://www.youtube.com/watch?v=HtyE1V6jXek;License: Standard Youtube License