
Essentials Of Business Analytics
1st Edition
ISBN: 9781285187273
Author: Camm, Jeff.
Publisher: Cengage Learning,
expand_more
expand_more
format_list_bulleted
Concept explainers
Videos
Textbook Question
Chapter 4, Problem 4P
A sociologist was hired by a large city hospital to investigate the relationship between the number of unauthorized days that employees are absent per year and the distance (miles) between home and work for the employees. A sample of 10 employees was chosen, and the following data were collected.
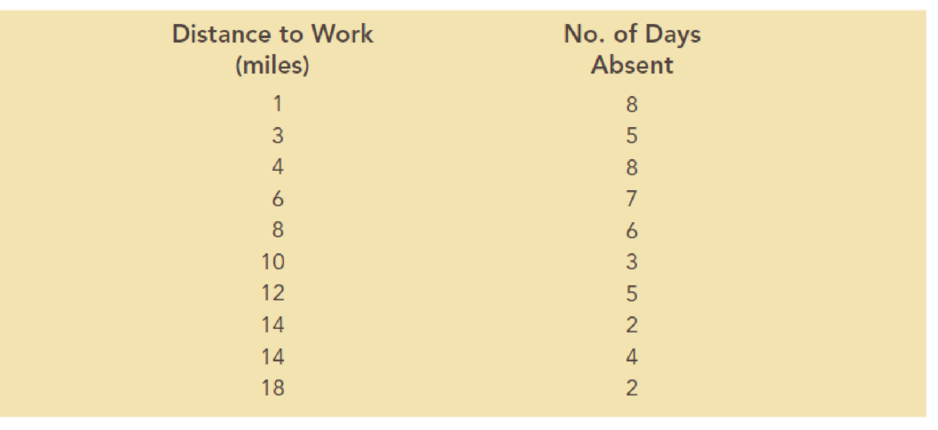
- a. Develop a scatter chart for these data. Does a linear relationship appear reasonable? Explain.
- b. Use the data to develop an estimated regression equation that could be used to predict the number of days absent given the distance to work. What is the estimated regression model?
- c. What is the 99% confidence interval for the regression parameter β1? Based on this interval, what conclusion can you make about the hypotheses that the regression parameter β1 is equal to zero?
- d. What is the 99% confidence interval for the regression parameter β0? Based on this interval, what conclusion can you make about the hypotheses that the regression parameter β0 is equal to zero?
- e. How much of the variation in the sample values of number of days absent does the model you estimated in part (b) explain?
Expert Solution & Answer
Want to see the full answer?
Check out a sample textbook solution
Students have asked these similar questions
NC Current Students - North Ce X | NC Canvas Login Links - North ( X
Final Exam Comprehensive x Cengage Learning
x
WASTAT - Final Exam - STAT
→
C
webassign.net/web/Student/Assignment-Responses/submit?dep=36055360&tags=autosave#question3659890_9
Part (b)
Draw a scatter plot of the ordered pairs.
N
Life
Expectancy
Life
Expectancy
80
70
600
50
40
30
20
10
Year of
1950
1970 1990
2010 Birth
O
Life
Expectancy
Part (c)
800
70
60
50
40
30
20
10
1950
1970 1990
W
ALT
林
$
#
4
R
J7
Year of
2010 Birth
F6
4+
80
70
60
50
40
30
20
10
Year of
1950 1970 1990
2010 Birth
Life
Expectancy
Ox
800
70
60
50
40
30
20
10
Year of
1950 1970 1990 2010 Birth
hp
P.B.
KA
&
7
80
% 5
H
A
B
F10
711
N
M
K
744
PRT SC
ALT
CTRL
Harvard University
California Institute of Technology
Massachusetts Institute of Technology
Stanford University
Princeton University
University of Cambridge
University of Oxford
University of California, Berkeley
Imperial College London
Yale University
University of California, Los Angeles
University of Chicago
Johns Hopkins University
Cornell University
ETH Zurich
University of Michigan
University of Toronto
Columbia University
University of Pennsylvania
Carnegie Mellon University
University of Hong Kong
University College London
University of Washington
Duke University
Northwestern University
University of Tokyo
Georgia Institute of Technology
Pohang University of Science and Technology
University of California, Santa Barbara
University of British Columbia
University of North Carolina at Chapel Hill
University of California, San Diego
University of Illinois at Urbana-Champaign
National University of Singapore
McGill…
Name
Harvard University
California Institute of Technology
Massachusetts Institute of Technology
Stanford University
Princeton University
University of Cambridge
University of Oxford
University of California, Berkeley
Imperial College London
Yale University
University of California, Los Angeles
University of Chicago
Johns Hopkins University
Cornell University
ETH Zurich
University of Michigan
University of Toronto
Columbia University
University of Pennsylvania
Carnegie Mellon University
University of Hong Kong
University College London
University of Washington
Duke University
Northwestern University
University of Tokyo
Georgia Institute of Technology
Pohang University of Science and Technology
University of California, Santa Barbara
University of British Columbia
University of North Carolina at Chapel Hill
University of California, San Diego
University of Illinois at Urbana-Champaign
National University of Singapore…
Chapter 4 Solutions
Essentials Of Business Analytics
Ch. 4 - Bicycling World, a magazine devoted to cycling,...Ch. 4 - In a manufacturing process the assembly line speed...Ch. 4 - Jensen Tire Auto is deciding whether to purchase...Ch. 4 - A sociologist was hired by a large city hospital...Ch. 4 - The regional transit authority for a major...Ch. 4 - A marketing professor at Givens College is...Ch. 4 - The Dow Jones Industrial Average (DJIA) and the...Ch. 4 - The Toyota Camry is one of the best-selling cars...Ch. 4 - Dixie Showtime Movie Theaters, Inc., owns and...Ch. 4 - Prob. 10P
Ch. 4 - The American Association of Individual Investors...Ch. 4 - The National Football League (NFL) records a...Ch. 4 - Johnson Filtration. Inc., provides maintenance...Ch. 4 - A study investigated the relationship between...Ch. 4 - The U.S. Department of Energys Fuel Economy Guide...Ch. 4 - A highway department is studying the relationship...Ch. 4 - A sample containing years to maturity and...Ch. 4 - In 2011, home prices and mortgage rates fell so...Ch. 4 - A recent 10-year study conducted by a research...Ch. 4 - The Scholastic Aptitude Test (or SAT) is a...Ch. 4 - Consider again the example introduced in Section...Ch. 4 - Alumni donations are an important source of...
Knowledge Booster


Learn more about
Need a deep-dive on the concept behind this application? Look no further. Learn more about this topic, statistics and related others by exploring similar questions and additional content below.Similar questions
- A company found that the daily sales revenue of its flagship product follows a normal distribution with a mean of $4500 and a standard deviation of $450. The company defines a "high-sales day" that is, any day with sales exceeding $4800. please provide a step by step on how to get the answers in excel Q: What percentage of days can the company expect to have "high-sales days" or sales greater than $4800? Q: What is the sales revenue threshold for the bottom 10% of days? (please note that 10% refers to the probability/area under bell curve towards the lower tail of bell curve) Provide answers in the yellow cellsarrow_forwardFind the critical value for a left-tailed test using the F distribution with a 0.025, degrees of freedom in the numerator=12, and degrees of freedom in the denominator = 50. A portion of the table of critical values of the F-distribution is provided. Click the icon to view the partial table of critical values of the F-distribution. What is the critical value? (Round to two decimal places as needed.)arrow_forwardA retail store manager claims that the average daily sales of the store are $1,500. You aim to test whether the actual average daily sales differ significantly from this claimed value. You can provide your answer by inserting a text box and the answer must include: Null hypothesis, Alternative hypothesis, Show answer (output table/summary table), and Conclusion based on the P value. Showing the calculation is a must. If calculation is missing,so please provide a step by step on the answers Numerical answers in the yellow cellsarrow_forward
arrow_back_ios
SEE MORE QUESTIONS
arrow_forward_ios
Recommended textbooks for you
 Functions and Change: A Modeling Approach to Coll...AlgebraISBN:9781337111348Author:Bruce Crauder, Benny Evans, Alan NoellPublisher:Cengage Learning
 Big Ideas Math A Bridge To Success Algebra 1: Stu...AlgebraISBN:9781680331141Author:HOUGHTON MIFFLIN HARCOURTPublisher:Houghton Mifflin Harcourt
 Glencoe Algebra 1, Student Edition, 9780079039897...AlgebraISBN:9780079039897Author:CarterPublisher:McGraw Hill
 Holt Mcdougal Larson Pre-algebra: Student Edition...AlgebraISBN:9780547587776Author:HOLT MCDOUGALPublisher:HOLT MCDOUGAL
 Algebra and Trigonometry (MindTap Course List)AlgebraISBN:9781305071742Author:James Stewart, Lothar Redlin, Saleem WatsonPublisher:Cengage Learning
 College AlgebraAlgebraISBN:9781305115545Author:James Stewart, Lothar Redlin, Saleem WatsonPublisher:Cengage Learning
Functions and Change: A Modeling Approach to Coll...
Algebra
ISBN:9781337111348
Author:Bruce Crauder, Benny Evans, Alan Noell
Publisher:Cengage Learning
Big Ideas Math A Bridge To Success Algebra 1: Stu...
Algebra
ISBN:9781680331141
Author:HOUGHTON MIFFLIN HARCOURT
Publisher:Houghton Mifflin Harcourt
Glencoe Algebra 1, Student Edition, 9780079039897...
Algebra
ISBN:9780079039897
Author:Carter
Publisher:McGraw Hill
Holt Mcdougal Larson Pre-algebra: Student Edition...
Algebra
ISBN:9780547587776
Author:HOLT MCDOUGAL
Publisher:HOLT MCDOUGAL
Algebra and Trigonometry (MindTap Course List)
Algebra
ISBN:9781305071742
Author:James Stewart, Lothar Redlin, Saleem Watson
Publisher:Cengage Learning
College Algebra
Algebra
ISBN:9781305115545
Author:James Stewart, Lothar Redlin, Saleem Watson
Publisher:Cengage Learning
Correlation Vs Regression: Difference Between them with definition & Comparison Chart; Author: Key Differences;https://www.youtube.com/watch?v=Ou2QGSJVd0U;License: Standard YouTube License, CC-BY
Correlation and Regression: Concepts with Illustrative examples; Author: LEARN & APPLY : Lean and Six Sigma;https://www.youtube.com/watch?v=xTpHD5WLuoA;License: Standard YouTube License, CC-BY