
Concept explainers
Find the force in each bar and mention the force is tension or compression of the bars in the truss.
Explanation of Solution
Assumptions:
- Consider the state of bars as tension (T) where the force is pulling the bar and as compression (C) where the force is pushing the bar.
- The sign of the force in the bar is positive when the force is in tension and negative when the force is in compression.
- Consider the force indicating right side as positive and left side as negative in horizontal components of forces.
- Consider the force indicating upward is taken as positive and downward as negative in vertical components of forces.
- Consider clockwise moment as negative and anti-clock wise moment as positive wherever applicable.
Show the free-body diagram of the entire truss as in Figure 1.
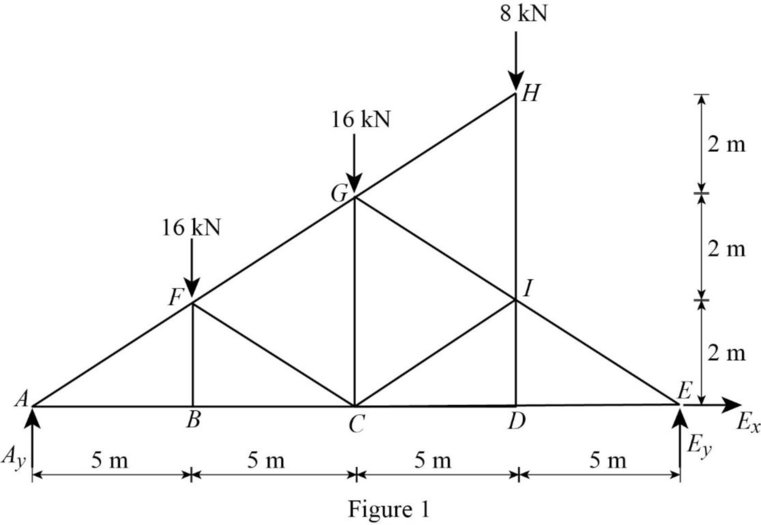
Find the vertical reaction at point E by taking moment about point A.
Find the vertical reaction at point A by resolving the vertical component of forces.
Find the horizontal reaction at point E by resolving the horizontal component of forces.
Consider the joint E;
Show the forces acting at the joint E as in Figure 2.
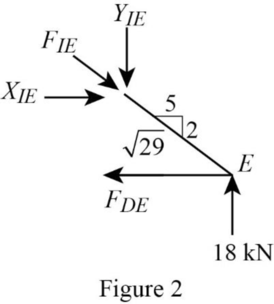
Resolve the vertical component of forces.
Use the proportion:
Resolve the horizontal component of forces.
Consider the joint D;
Show the forces acting at the joint D as in Figure 3.
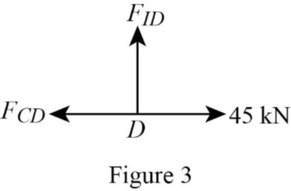
Resolve the vertical component of forces.
Resolve the horizontal component of forces.
Consider the joint A;
Show the forces acting at the joint A as in Figure 4.
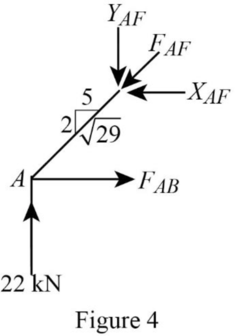
Resolve the vertical component of forces.
Use the proportion:
Resolve the horizontal component of forces.
Consider the joint B;
Show the forces acting at the joint B as in Figure 5.
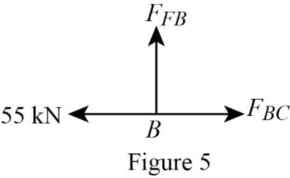
Resolve the vertical component of forces.
Resolve the horizontal component of forces.
Consider the joint F;
Show the forces acting at the joint F as in Figure 6.
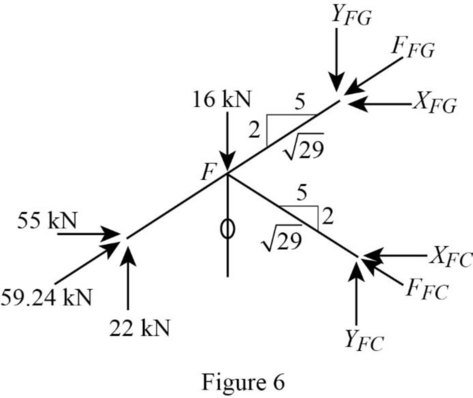
Resolve the vertical component of forces.
Resolve the horizontal component of forces.
Use the proportion:
Substitute
Substitute
Solve equation (3) and (4).
Consider the joint C;
Show the forces acting at the joint C as in Figure 7.
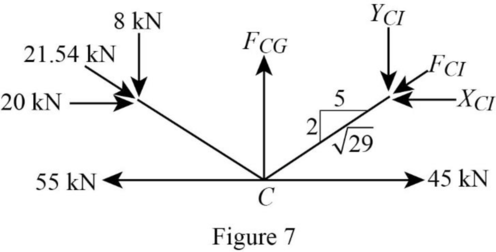
Resolve the horizontal component of forces.
Use the proportion:
Resolve the vertical component of forces.
Consider the joint H;
Show the forces acting at the joint H as in Figure 8.
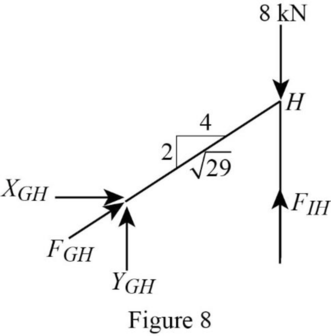
Resolve the horizontal component of forces.
Use the proportion:
Resolve the vertical component of forces.
Consider the joint G;
Show the forces acting at the joint G as in Figure 9.
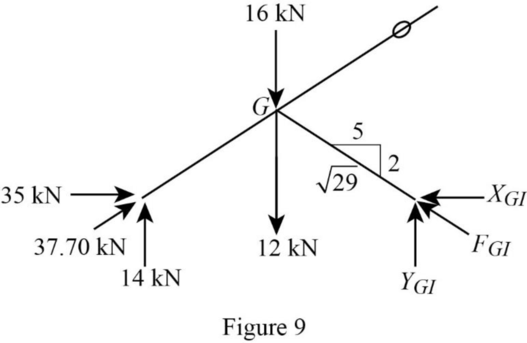
Resolve the horizontal component of forces.
Use the proportion:
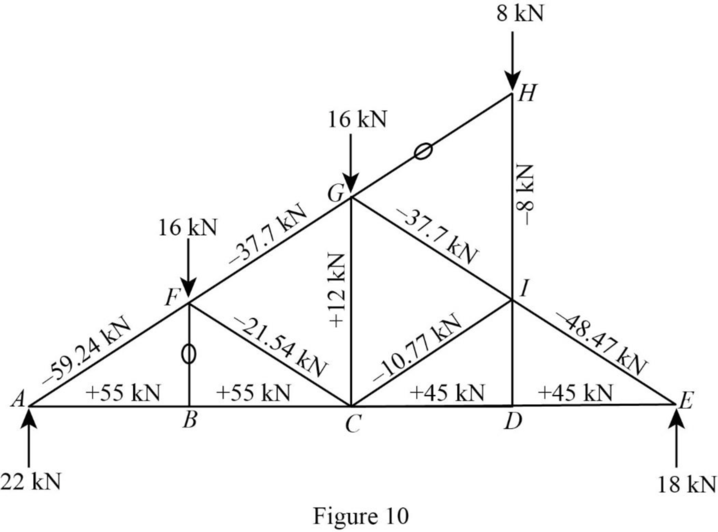
Show the forces in the bars of the truss as in Figure 10.
Want to see more full solutions like this?
Chapter 4 Solutions
UCD FUND OF STRUCTURAL ANALYSIS 5E


- Develop a signal design and timing for the intersection shown in the figure below. In each case accommodate both vehicular and pedestrian movements. In general, use the following values for the problem: pedestrian walking speed = 1 [m/s], vehicle deceleration = 3 [m/s²], driver reaction time = 1.5 [s], length of vehicle = 6 [m], and level grade = 0. If you need to assume other variables and parameters to solve this problem clearly state that in your report and explain the reason. A250 1100 One-way Speed limit = 50 [km/h] Pedestrian = 15 per each crosswalk Crosswalk widths = 3 [m] Lane width = 4 [m] Saturation flow = 1800 [veh/h/lane] 1100 ↑ 200 70 80 900arrow_forwardhow land use and urban structure contribute to financial stability or instability.arrow_forwardQ1 parts B and C but plz draw it out or something plz put it on a bread board with resistors and a voltage source please do not show it in the schematic way like in the picture there if you can show it on like thinkercadarrow_forward
- Sketch the effective stress profile for the silt layer to a depth of 5 meters for a uniform layer of silt having a depth to the water table of 4 m (choose several discrete points with depth and plot by hand). Use Bishop's definition of effective stress for the silt layer, assuming x =S.. Assume a value of G. = 2.65 and that the gravimetric water content of the silt below the water table is 20%. Use the SWRC for the silt from the figure below. Assume that the air pressure is equal to atmospheric pressure (i.e., zero). Consider variations in total unit weight with the degree of saturation in your calculations. 100000 a. 10000 Sand: a = 0.3 kPa, n = 3.0 Silt: a=0.05 kPa, n=2.5 0.01 kPa, n = 1.8 1000 Clay: Matric suction (kPa) 00 100 10 10 1 0.1 ° 20 60 80 40 Saturation (%) 100 10arrow_forwardYou are asked to design a two-story commercial building that has reinforced masonry shear walls as shown below. The height of the parapet above the roof is 2 feet. The walls are to be constructed of 8-inch CMU and are to be fully grouted. The building is assigned to SDC D, and therefore, the walls have to be special RM shear walls according to TMS 402. There are 6 shear walls to resist the lateral seismic force along one principal axis of the building and 4 shear walls along the other axis. The corner walls are flanged walls meeting the requirements in Sec. 5.2.3 of TMS 402-22. The columns carry only gravity loads and no lateral seismic forces. The floor and roof diaphragms are relatively flexible in out-of-plane bending compared to the in-plane flexural stiffness of the walls, so that you can ignore the coupling moments and shear forces exerted by the diaphragms on the walls. However, the in-plane stiffness of the diagrams is high so that their planar deformation can be ignored.…arrow_forwardDevelop a signal design and timing for the intersection shown in the figure below. In each case accommodate both vehicular and pedestrian movements. In general, use the following values for the problem: pedestrian walking speed = 1 [m/s], vehicle deceleration = 3 [m/s²], driver reaction time = 1.5 [s], length of vehicle 6 [m], and level grade = 0. If you need to assume = other variables and parameters to solve this problem clearly state that in your report and explain the reason. 250 1100 One-way Speed limit = 50 [km/h] Pedestrian = 15 per each crosswalk Crosswalk widths = 3 [m] Lane width = 4 [m] Saturation flow = 1800 [veh/h/lane] 1100 70 80 T 200 900arrow_forward
- A pre-timed four-phase signal has critical lane group flow rates for the first three phases of 260, 280, and 310 [veh/h] (saturation flow rates are 2000 [veh/h/In] for all phases). The lost time is known to be 5 seconds for each phase. If the cycle length is 90 seconds, what is the estimated effective green time of the fourth phase?arrow_forwarda. Assume a bus line with N stops, where the distance between stops is S. Free flow speed of the bus is v, with acceleration and deceleration, a. P passengers per stop are boarding and alighting, and the time needed for a passenger to board or alight is T seconds. What is the average speed of a bus? b. Following on part (a), assume the origins of passengers are spread uniformly along the bus route. The destination of all passengers is the last stop. The walking speed of passengers is u. Determine the average travel time (walking + in-vehicle) of passengers. c. Simplify the above equation when N is large enough (approximating N-1/2 by N-1). Consider now that you can decide on S, where you replace N=L/S (L is the length of the route). Find the value of S that minimises the travelling time of the passengers. d. In the same setting as (c), assume that some passengers do not go to the terminal but alight before. Explain if your answer from (c) would increase or decrease and why. If you need…arrow_forwardThe minimum cycle length for an intersection is determined to be 95 seconds. The critical lane group flow ratios were calculated as 0.235, 0.25, 0.17, and 0.125, respectively. Assuming 5 seconds lost per phase, determine which X was used.arrow_forward
- A four-phase traffic signal has critical lane group flow ratios of 0.250, 0.150, 0.225 and 0.125. If the lost time per phase is 4 seconds and a critical intersection v/c of 0.85 is desired, calculate the minimum cycle length and the phase effective green times such that the lane group v/c ratios are equalized.arrow_forwardA pre-timed four-phase signal has critical lane group flow rates for the first three phases of 260, 280, and 310 [veh/h] (saturation flow rates are 2000 [veh/h/ln] for all phases). The lost time is known to be 5 seconds for each phase. If the cycle length is 90 seconds, what is the estimated effective green time of the fourth phase?arrow_forwardPLEASE SOLVE THE QUESTIONS IN THE PICTURE, make sure you show all of your work please. Thank you for your help!arrow_forward

 Structural Analysis (10th Edition)Civil EngineeringISBN:9780134610672Author:Russell C. HibbelerPublisher:PEARSON
 Principles of Foundation Engineering (MindTap Cou...Civil EngineeringISBN:9781337705028Author:Braja M. Das, Nagaratnam SivakuganPublisher:Cengage Learning
 Fundamentals of Structural AnalysisCivil EngineeringISBN:9780073398006Author:Kenneth M. Leet Emeritus, Chia-Ming Uang, Joel LanningPublisher:McGraw-Hill Education
 Traffic and Highway EngineeringCivil EngineeringISBN:9781305156241Author:Garber, Nicholas J.Publisher:Cengage Learning