
Mind on Statistics
5th Edition
ISBN: 9781285463186
Author: Jessica M. Utts, Robert F. Heckard
Publisher: Brooks Cole
expand_more
expand_more
format_list_bulleted
Concept explainers
Videos
Textbook Question
Chapter 4, Problem 4.3E
Each fall, auditions for the band and orchestra are held at a large university. Last fall, the numbers of males and females in each class who auditioned were as follows:
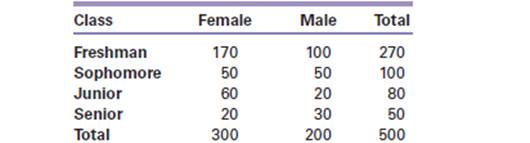
a. Calculate the row percentage for freshman females and explain what it means.
h. Calculate the column percentage for freshman females and explain what it means.
c. Which class had the highest percentage of female applicants? Support your answer with numbers.
d. Which sex had a higher percentage of sophomore applicants? Support your answer with numbers.
Expert Solution & Answer
Want to see the full answer?
Check out a sample textbook solution
Students have asked these similar questions
please find the answers for the yellows boxes using the information and the picture below
A marketing agency wants to determine whether different advertising platforms generate significantly different levels of customer engagement. The agency measures the average number of daily clicks on ads for three platforms: Social Media, Search Engines, and Email Campaigns. The agency collects data on daily clicks for each platform over a 10-day period and wants to test whether there is a statistically significant difference in the mean number of daily clicks among these platforms. Conduct ANOVA test.
You can provide your answer by inserting a text box and the answer must include: also please provide a step by on getting the answers in excel
Null hypothesis,
Alternative hypothesis,
Show answer (output table/summary table), and
Conclusion based on the P value.
A company found that the daily sales revenue of its flagship product follows a normal distribution with a mean of $4500 and a standard deviation of $450. The company defines a "high-sales day" that is, any day with sales exceeding $4800. please provide a step by step on how to get the answers
Q: What percentage of days can the company expect to have "high-sales days" or sales greater than $4800?
Q: What is the sales revenue threshold for the bottom 10% of days? (please note that 10% refers to the probability/area under bell curve towards the lower tail of bell curve)
Provide answers in the yellow cells
Chapter 4 Solutions
Mind on Statistics
Ch. 4 - Prob. 4.1ECh. 4 - Prob. 4.2ECh. 4 - Each fall, auditions for the band and orchestra...Ch. 4 - Prob. 4.4ECh. 4 - For each pair of variables, indicate whether or...Ch. 4 - For each pair of variables, indicate whether or...Ch. 4 - Suppose a study on the relationship between gender...Ch. 4 - Prob. 4.8ECh. 4 - Prob. 4.9ECh. 4 - Do grumpy old men have a greater risk of having...
Ch. 4 - Prob. 4.11ECh. 4 - Prob. 4.12ECh. 4 - Prob. 4.13ECh. 4 - Prob. 4.14ECh. 4 - Prob. 4.15ECh. 4 - Prob. 4.16ECh. 4 - For Exercise 4.17 and 4.18: A study is done to...Ch. 4 - For Exercise 4.17 and 4.18: A study is done to...Ch. 4 - Prob. 4.19ECh. 4 - a. For a relative risk of 2.1, what is the percent...Ch. 4 - a. For a relative risk of 1.53, what is the...Ch. 4 - Science News (February 25, 1995, p. 124) reported...Ch. 4 - Prob. 4.23ECh. 4 - Prob. 4.24ECh. 4 - Exercise 4.10 described a study in which men were...Ch. 4 - Prob. 4.26ECh. 4 - Prob. 4.27ECh. 4 - Suppose a newspaper article states that drinking...Ch. 4 - Prob. 4.29ECh. 4 - Prob. 4.30ECh. 4 - Prob. 4.31ECh. 4 - Case Study 1.5 (p. 4) was called Does Prayer Lower...Ch. 4 - Prob. 4.33ECh. 4 - Prob. 4.34ECh. 4 - Prob. 4.35ECh. 4 - Prob. 4.36ECh. 4 - Prob. 4.37ECh. 4 - Prob. 4.38ECh. 4 - Prob. 4.39ECh. 4 - Researchers studied a random sample of North...Ch. 4 - Refer to Exercise 4.40. a. Write a two-way table...Ch. 4 - In a national survey, n=1000 randomly selected...Ch. 4 - Prob. 4.43ECh. 4 - Prob. 4.44ECh. 4 - Prob. 4.45ECh. 4 - Prob. 4.46ECh. 4 - Prob. 4.47ECh. 4 - Prob. 4.48ECh. 4 - Prob. 4.49ECh. 4 - Prob. 4.50ECh. 4 - Prob. 4.51ECh. 4 - Prob. 4.52ECh. 4 - Refer to the Minitab output for Exercise 4.52. The...Ch. 4 - Prob. 4.54ECh. 4 - Prob. 4.55ECh. 4 - Prob. 4.56ECh. 4 - Prob. 4.57ECh. 4 - Prob. 4.58ECh. 4 - Exercise 4.2 (p.136) gave the following data from...Ch. 4 - In Example 4.15 (p. 130), a statistically...Ch. 4 - Prob. 4.61ECh. 4 - Prob. 4.62ECh. 4 - Prob. 4.63ECh. 4 - Prob. 4.64ECh. 4 - Prob. 4.65ECh. 4 - Prob. 4.66ECh. 4 - Prob. 4.67ECh. 4 - Prob. 4.68ECh. 4 - Prob. 4.69ECh. 4 - Prob. 4.70ECh. 4 - Prob. 4.71ECh. 4 - Prob. 4.72ECh. 4 - Prob. 4.73ECh. 4 - Prob. 4.74ECh. 4 - Prob. 4.75ECh. 4 - Prob. 4.76ECh. 4 - Prob. 4.77ECh. 4 - Prob. 4.78ECh. 4 - Prob. 4.79ECh. 4 - Prob. 4.80ECh. 4 - Prob. 4.81ECh. 4 - Prob. 4.82ECh. 4 - Prob. 4.83ECh. 4 - Prob. 4.84E
Knowledge Booster


Learn more about
Need a deep-dive on the concept behind this application? Look no further. Learn more about this topic, statistics and related others by exploring similar questions and additional content below.Similar questions
- Business Discussarrow_forwardThe following data represent total ventilation measured in liters of air per minute per square meter of body area for two independent (and randomly chosen) samples. Analyze these data using the appropriate non-parametric hypothesis testarrow_forwardeach column represents before & after measurements on the same individual. Analyze with the appropriate non-parametric hypothesis test for a paired design.arrow_forward
- Should you be confident in applying your regression equation to estimate the heart rate of a python at 35°C? Why or why not?arrow_forwardGiven your fitted regression line, what would be the residual for snake #5 (10 C)?arrow_forwardCalculate the 95% confidence interval around your estimate of r using Fisher’s z-transformation. In your final answer, make sure to back-transform to the original units.arrow_forward
arrow_back_ios
SEE MORE QUESTIONS
arrow_forward_ios
Recommended textbooks for you
 Glencoe Algebra 1, Student Edition, 9780079039897...AlgebraISBN:9780079039897Author:CarterPublisher:McGraw Hill
 Holt Mcdougal Larson Pre-algebra: Student Edition...AlgebraISBN:9780547587776Author:HOLT MCDOUGALPublisher:HOLT MCDOUGAL
 College Algebra (MindTap Course List)AlgebraISBN:9781305652231Author:R. David Gustafson, Jeff HughesPublisher:Cengage Learning
 College AlgebraAlgebraISBN:9781305115545Author:James Stewart, Lothar Redlin, Saleem WatsonPublisher:Cengage Learning
 Algebra: Structure And Method, Book 1AlgebraISBN:9780395977224Author:Richard G. Brown, Mary P. Dolciani, Robert H. Sorgenfrey, William L. ColePublisher:McDougal Littell
Glencoe Algebra 1, Student Edition, 9780079039897...
Algebra
ISBN:9780079039897
Author:Carter
Publisher:McGraw Hill
Holt Mcdougal Larson Pre-algebra: Student Edition...
Algebra
ISBN:9780547587776
Author:HOLT MCDOUGAL
Publisher:HOLT MCDOUGAL
College Algebra (MindTap Course List)
Algebra
ISBN:9781305652231
Author:R. David Gustafson, Jeff Hughes
Publisher:Cengage Learning
College Algebra
Algebra
ISBN:9781305115545
Author:James Stewart, Lothar Redlin, Saleem Watson
Publisher:Cengage Learning
Algebra: Structure And Method, Book 1
Algebra
ISBN:9780395977224
Author:Richard G. Brown, Mary P. Dolciani, Robert H. Sorgenfrey, William L. Cole
Publisher:McDougal Littell
Correlation Vs Regression: Difference Between them with definition & Comparison Chart; Author: Key Differences;https://www.youtube.com/watch?v=Ou2QGSJVd0U;License: Standard YouTube License, CC-BY
Correlation and Regression: Concepts with Illustrative examples; Author: LEARN & APPLY : Lean and Six Sigma;https://www.youtube.com/watch?v=xTpHD5WLuoA;License: Standard YouTube License, CC-BY