
Intro Stats
4th Edition
ISBN: 9780321826275
Author: Richard D. De Veaux
Publisher: PEARSON
expand_more
expand_more
format_list_bulleted
Concept explainers
Videos
Textbook Question
Chapter 4, Problem 28E
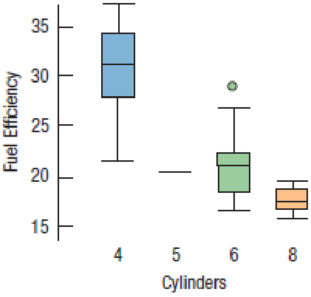
Fuel economy and cylinders Describe what these boxplots tell you about the relationship between the number of cylinders a car’s engine has and the car’s fuel economy (mpg).
Expert Solution & Answer
Want to see the full answer?
Check out a sample textbook solution
Students have asked these similar questions
1. A consumer group claims that the mean annual consumption of cheddar cheese by a person in
the United States is at most 10.3 pounds. A random sample of 100 people in the United States has
a mean annual cheddar cheese consumption of 9.9 pounds. Assume the population standard
deviation is 2.1 pounds. At a = 0.05, can you reject the claim? (Adapted from U.S. Department of
Agriculture)
State the hypotheses:
Calculate the test statistic:
Calculate the P-value:
Conclusion (reject or fail to reject Ho):
2. The CEO of a manufacturing facility claims that the mean workday of the company's assembly
line employees is less than 8.5 hours. A random sample of 25 of the company's assembly line
employees has a mean workday of 8.2 hours. Assume the population standard deviation is 0.5
hour and the population is normally distributed. At a = 0.01, test the CEO's claim.
State the hypotheses:
Calculate the test statistic:
Calculate the P-value:
Conclusion (reject or fail to reject Ho):
Statistics
21.
find the mean.
and
variance of the
following:
Ⓒ x(t) = Ut +V, and V indepriv. s.t
U.VN NL0, 63).
X(t) = t² + Ut +V, U and V incepires have N (0,8)
Ut
①xt = e UNN (0162)
~ X+ = UCOSTE, UNNL0, 62)
SU, Oct
⑤Xt=
7
where U. Vindp.rus
+> ½
have NL, 62).
⑥Xn = ΣY, 41, 42, 43, ... Yn vandom sample
K=1
Text
with mean zen and variance 6
A psychology researcher conducted a Chi-Square Test of Independence to examine whether there is a relationship between college students’ year in school (Freshman, Sophomore, Junior, Senior) and their preferred coping strategy for academic stress (Problem-Focused, Emotion-Focused, Avoidance). The test yielded the following result:
image.png
Interpret the results of this analysis. In your response, clearly explain:
Whether the result is statistically significant and why.
What this means about the relationship between year in school and coping strategy.
What the researcher should conclude based on these findings.
Chapter 4 Solutions
Intro Stats
Ch. 4.2 - The Bureau of Transportation Statistics of the...Ch. 4.2 - The Bureau of Transportation Statistics of the...Ch. 4.2 - Prob. 3JCCh. 4 - Prob. 1ECh. 4 - Prob. 2ECh. 4 - Prob. 3ECh. 4 - 4. Load factors by year Here is a display of the...Ch. 4 - Prob. 5ECh. 4 - Prob. 6ECh. 4 - Prob. 7E
Ch. 4 - Prob. 8ECh. 4 - Prob. 9ECh. 4 - Exoplanets re-expressed Here are the exoplanet...Ch. 4 - Prob. 15ECh. 4 - Prob. 16ECh. 4 - Prob. 17ECh. 4 - Prob. 18ECh. 4 - Sugar in cereals Sugar is a major ingredient in...Ch. 4 - Tendon transfers People with spinal cord injuries...Ch. 4 - Prob. 21ECh. 4 - Camp sites Shown below are the histogram and...Ch. 4 - Hospital stays The U.S. National Center for Health...Ch. 4 - Prob. 24ECh. 4 - Womens basketball Here are boxplots of the points...Ch. 4 - Prob. 26ECh. 4 - Marriage age In 1975, did men and women marry at...Ch. 4 - Fuel economy and cylinders Describe what these...Ch. 4 - Prob. 29ECh. 4 - Ozone Ozone levels (in parts per billion, ppb)...Ch. 4 - Test scores Three statistics classes all took the...Ch. 4 - Prob. 32ECh. 4 - Graduation? A survey of major universities asked...Ch. 4 - Vineyards Here are summary statistics for the...Ch. 4 - Caffeine A student study of the effects of...Ch. 4 - SAT scores Here are the summary statistics for...Ch. 4 - Prob. 37ECh. 4 - Framingham cholesterol The Framingham Heart Study...Ch. 4 - Prob. 39ECh. 4 - Cloud seeding In an experiment to determine...Ch. 4 - Industrial experiment Engineers at a computer...Ch. 4 - Cholesterol and smoking A study that examined the...Ch. 4 - Prob. 43ECh. 4 - Prob. 44ECh. 4 - Prob. 45ECh. 4 - Prob. 46ECh. 4 - Assets Here is a histogram of the assets (in...Ch. 4 - Prob. 48ECh. 4 - Assets again Here are the same data you saw in...Ch. 4 - Rainmakers The table lists the amounts of rainfall...Ch. 4 - Stereograms Stereograms appear to be composed...Ch. 4 - Stereograms, revisited Because of the skewness of...
Additional Math Textbook Solutions
Find more solutions based on key concepts
For Exercises 13–18, write the negation of the statement.
13. The cell phone is out of juice.
Math in Our World
Find all solutions of each equation in the interval .
Precalculus: A Unit Circle Approach (3rd Edition)
Reading, Writing, and Rounding Whole Numbers Write in words. 357
Mathematics for the Trades: A Guided Approach (11th Edition) (What's New in Trade Math)
1. How is a sample related to a population?
Elementary Statistics: Picturing the World (7th Edition)
Check Your Understanding
Reading Check Complete each sentence using > or < for □.
RC1. 3 dm □ 3 dam
Basic College Mathematics
Knowledge Booster


Learn more about
Need a deep-dive on the concept behind this application? Look no further. Learn more about this topic, statistics and related others by exploring similar questions and additional content below.Similar questions
- A school counselor is conducting a research study to examine whether there is a relationship between the number of times teenagers report vaping per week and their academic performance, measured by GPA. The counselor collects data from a sample of high school students. Write the null and alternative hypotheses for this study. Clearly state your hypotheses in terms of the correlation between vaping frequency and academic performance. EditViewInsertFormatToolsTable 12pt Paragrapharrow_forwardA smallish urn contains 25 small plastic bunnies – 7 of which are pink and 18 of which are white. 10 bunnies are drawn from the urn at random with replacement, and X is the number of pink bunnies that are drawn. (a) P(X = 5) ≈ (b) P(X<6) ≈ The Whoville small urn contains 100 marbles – 60 blue and 40 orange. The Grinch sneaks in one night and grabs a simple random sample (without replacement) of 15 marbles. (a) The probability that the Grinch gets exactly 6 blue marbles is [ Select ] ["≈ 0.054", "≈ 0.043", "≈ 0.061"] . (b) The probability that the Grinch gets at least 7 blue marbles is [ Select ] ["≈ 0.922", "≈ 0.905", "≈ 0.893"] . (c) The probability that the Grinch gets between 8 and 12 blue marbles (inclusive) is [ Select ] ["≈ 0.801", "≈ 0.760", "≈ 0.786"] . The Whoville small urn contains 100 marbles – 60 blue and 40 orange. The Grinch sneaks in one night and grabs a simple random sample (without replacement) of 15 marbles. (a)…arrow_forwardSuppose an experiment was conducted to compare the mileage(km) per litre obtained by competing brands of petrol I,II,III. Three new Mazda, three new Toyota and three new Nissan cars were available for experimentation. During the experiment the cars would operate under same conditions in order to eliminate the effect of external variables on the distance travelled per litre on the assigned brand of petrol. The data is given as below: Brands of Petrol Mazda Toyota Nissan I 10.6 12.0 11.0 II 9.0 15.0 12.0 III 12.0 17.4 13.0 (a) Test at the 5% level of significance whether there are signi cant differences among the brands of fuels and also among the cars. [10] (b) Compute the standard error for comparing any two fuel brands means. Hence compare, at the 5% level of significance, each of fuel brands II, and III with the standard fuel brand I. [10] �arrow_forward
- Analyze the residuals of a linear regression model and select the best response. yes, the residual plot does not show a curve no, the residual plot shows a curve yes, the residual plot shows a curve no, the residual plot does not show a curve I answered, "No, the residual plot shows a curve." (and this was incorrect). I am not sure why I keep getting these wrong when the answer seems obvious. Please help me understand what the yes and no references in the answer.arrow_forwarda. Find the value of A.b. Find pX(x) and py(y).c. Find pX|y(x|y) and py|X(y|x)d. Are x and y independent? Why or why not?arrow_forwardAnalyze the residuals of a linear regression model and select the best response.Criteria is simple evaluation of possible indications of an exponential model vs. linear model) no, the residual plot does not show a curve yes, the residual plot does not show a curve yes, the residual plot shows a curve no, the residual plot shows a curve I selected: yes, the residual plot shows a curve and it is INCORRECT. Can u help me understand why?arrow_forward
- You have been hired as an intern to run analyses on the data and report the results back to Sarah; the five questions that Sarah needs you to address are given below. please do it step by step on excel Does there appear to be a positive or negative relationship between price and screen size? Use a scatter plot to examine the relationship. Determine and interpret the correlation coefficient between the two variables. In your interpretation, discuss the direction of the relationship (positive, negative, or zero relationship). Also discuss the strength of the relationship. Estimate the relationship between screen size and price using a simple linear regression model and interpret the estimated coefficients. (In your interpretation, tell the dollar amount by which price will change for each unit of increase in screen size). Include the manufacturer dummy variable (Samsung=1, 0 otherwise) and estimate the relationship between screen size, price and manufacturer dummy as a multiple…arrow_forwardHere is data with as the response variable. x y54.4 19.124.9 99.334.5 9.476.6 0.359.4 4.554.4 0.139.2 56.354 15.773.8 9-156.1 319.2Make a scatter plot of this data. Which point is an outlier? Enter as an ordered pair, e.g., (x,y). (x,y)= Find the regression equation for the data set without the outlier. Enter the equation of the form mx+b rounded to three decimal places. y_wo= Find the regression equation for the data set with the outlier. Enter the equation of the form mx+b rounded to three decimal places. y_w=arrow_forwardYou have been hired as an intern to run analyses on the data and report the results back to Sarah; the five questions that Sarah needs you to address are given below. please do it step by step Does there appear to be a positive or negative relationship between price and screen size? Use a scatter plot to examine the relationship. Determine and interpret the correlation coefficient between the two variables. In your interpretation, discuss the direction of the relationship (positive, negative, or zero relationship). Also discuss the strength of the relationship. Estimate the relationship between screen size and price using a simple linear regression model and interpret the estimated coefficients. (In your interpretation, tell the dollar amount by which price will change for each unit of increase in screen size). Include the manufacturer dummy variable (Samsung=1, 0 otherwise) and estimate the relationship between screen size, price and manufacturer dummy as a multiple linear…arrow_forward
arrow_back_ios
SEE MORE QUESTIONS
arrow_forward_ios
Recommended textbooks for you
 Glencoe Algebra 1, Student Edition, 9780079039897...AlgebraISBN:9780079039897Author:CarterPublisher:McGraw Hill
 Holt Mcdougal Larson Pre-algebra: Student Edition...AlgebraISBN:9780547587776Author:HOLT MCDOUGALPublisher:HOLT MCDOUGAL
 Elementary AlgebraAlgebraISBN:9780998625713Author:Lynn Marecek, MaryAnne Anthony-SmithPublisher:OpenStax - Rice University
 College AlgebraAlgebraISBN:9781305115545Author:James Stewart, Lothar Redlin, Saleem WatsonPublisher:Cengage Learning
 Algebra and Trigonometry (MindTap Course List)AlgebraISBN:9781305071742Author:James Stewart, Lothar Redlin, Saleem WatsonPublisher:Cengage Learning
 Functions and Change: A Modeling Approach to Coll...AlgebraISBN:9781337111348Author:Bruce Crauder, Benny Evans, Alan NoellPublisher:Cengage Learning
Glencoe Algebra 1, Student Edition, 9780079039897...
Algebra
ISBN:9780079039897
Author:Carter
Publisher:McGraw Hill
Holt Mcdougal Larson Pre-algebra: Student Edition...
Algebra
ISBN:9780547587776
Author:HOLT MCDOUGAL
Publisher:HOLT MCDOUGAL
Elementary Algebra
Algebra
ISBN:9780998625713
Author:Lynn Marecek, MaryAnne Anthony-Smith
Publisher:OpenStax - Rice University
College Algebra
Algebra
ISBN:9781305115545
Author:James Stewart, Lothar Redlin, Saleem Watson
Publisher:Cengage Learning
Algebra and Trigonometry (MindTap Course List)
Algebra
ISBN:9781305071742
Author:James Stewart, Lothar Redlin, Saleem Watson
Publisher:Cengage Learning
Functions and Change: A Modeling Approach to Coll...
Algebra
ISBN:9781337111348
Author:Bruce Crauder, Benny Evans, Alan Noell
Publisher:Cengage Learning
Correlation Vs Regression: Difference Between them with definition & Comparison Chart; Author: Key Differences;https://www.youtube.com/watch?v=Ou2QGSJVd0U;License: Standard YouTube License, CC-BY
Correlation and Regression: Concepts with Illustrative examples; Author: LEARN & APPLY : Lean and Six Sigma;https://www.youtube.com/watch?v=xTpHD5WLuoA;License: Standard YouTube License, CC-BY