
Concept explainers
(a):
The equilibrium
(a):
Explanation of Solution
The equilibrium demand and supply of milk in the economy can be obtained at the point of intersection of the market demand and supply curves in the economy. The market demand and supply schedules are given, and a graph can be plotted on the basis of the schedule as follows:
|
Quantity demanded (millions of gallons) |
Quantity supplied (millions of gallons) | |
| $10.00 | 100 | 500 |
| 8.00 | 200 | 400 |
| 6.00 | 300 | 300 |
| 4.00 | 400 | 200 |
| 2.00 | 500 | 100 |
Based on this table, it is identified that the quantity supplied increases as price increases and there is a direct and positive relation between the price and quantity supplied. On the other hand, there is a negative relation between the quantity demanded and price because the quantity demanded decreases as price increases. Thus, the quantity demanded will be indicated by a downward sloping curve, whereas the quantity supplied will be indicated by an upward sloping curve as follows:
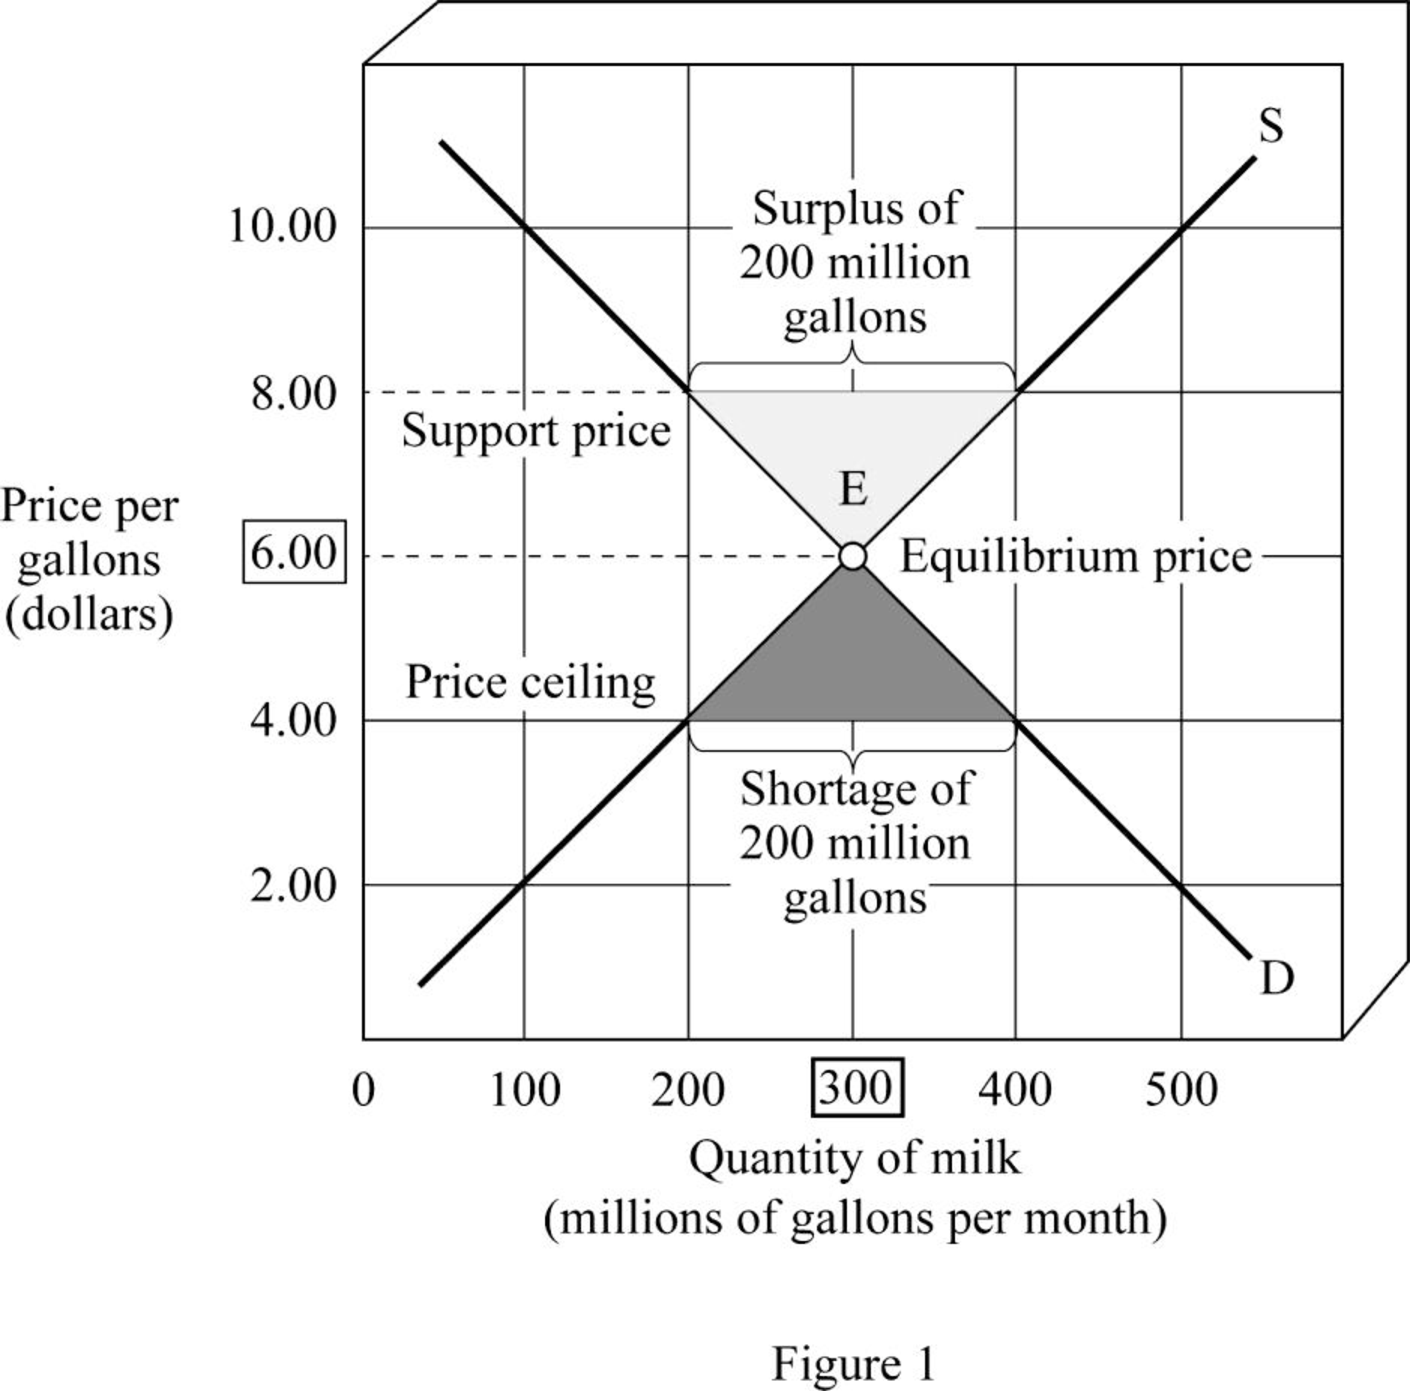
From the diagram, it is observed that the market demand for milk and the supply of milk intersect at Point E. The corresponding quantity at Point E will be the
Equilibrium: Equilibrium in the market is obtained at the point where the market demand is equal to the market supply, and there is no excess demand or supply present in the economy.
(b):
The effect of support price of $8 per gallon of milk.
(b):
Explanation of Solution
From the diagram, it is observed that the market demand for milk and the supply of milk intersect at Point E. The corresponding quantity Point E will be the equilibrium quantity of milk and the corresponding price Point E will be the equilibrium price of the milk. Thus, at the point of equilibrium E, the equilibrium price is $6 per gallon and the quantity is 300 gallons per month.
However, when the government enacts the support price of $8 per gallon, the market price will be $8 per gallon. The quantity demanded at this price is 200 gallons per month, whereas the quantity supplied is 400 gallons per month. This means that there will be a surplus of 200 gallons of milk in the economy. The government has to purchase this excess surplus from the market. Since the government revenue is the tax revenue, the non–milk-drinking taxpayers have to pay for the milk indirectly.
(c):
The effect of ceiling price of $4 per gallon of milk.
(c):
Explanation of Solution
When the government enacts the ceiling price of $4 per gallon, the market price will be $4 per gallon. The quantity demanded at this price is 400 gallons per month, whereas the quantity supplied is 200 gallons per month. This means that there will be a shortage of 200 gallons of milk in the economy. The government has to ration the milk in order to prevent the black marketing of milk. This is caused due to the action of the government to keep the price of milk below the equilibrium level of $6 per gallon.
Want to see more full solutions like this?
Chapter 4 Solutions
Microeconomics For Today (MindTap Course List)


- You are the manager of a large automobile dealership who wants to learn more about the effective- ness of various discounts offered to customers over the past 14 months. Following are the average negotiated prices for each month and the quantities sold of a basic model (adjusted for various options) over this period of time. 1. Graph this information on a scatter plot. Estimate the demand equation. What do the regression results indicate about the desirability of discounting the price? Explain. Month Price Quantity Jan. 12,500 15 Feb. 12,200 17 Mar. 11,900 16 Apr. 12,000 18 May 11,800 20 June 12,500 18 July 11,700 22 Aug. 12,100 15 Sept. 11,400 22 Oct. 11,400 25 Nov. 11,200 24 Dec. 11,000 30 Jan. 10,800 25 Feb. 10,000 28 2. What other factors besides price might be included in this equation? Do you foresee any difficulty in obtaining these additional data or incorporating them in the regression analysis?arrow_forwardsimple steps on how it should look like on excelarrow_forwardConsider options on a stock that does not pay dividends.The stock price is $100 per share, and the risk-free interest rate is 10%.Thestock moves randomly with u=1.25and d=1/u Use Excel to calculate the premium of a10-year call with a strike of $100.arrow_forward
- Please solve this, no words or explanations.arrow_forward17. Given that C=$700+0.8Y, I=$300, G=$600, what is Y if Y=C+I+G?arrow_forwardUse the Feynman technique throughout. Assume that you’re explaining the answer to someone who doesn’t know the topic at all. Write explanation in paragraphs and if you use currency use USD currency: 10. What is the mechanism or process that allows the expenditure multiplier to “work” in theKeynesian Cross Model? Explain and show both mathematically and graphically. What isthe underpinning assumption for the process to transpire?arrow_forward
- Use the Feynman technique throughout. Assume that you’reexplaining the answer to someone who doesn’t know the topic at all. Write it all in paragraphs: 2. Give an overview of the equation of exchange (EoE) as used by Classical Theory. Now,carefully explain each variable in the EoE. What is meant by the “quantity theory of money”and how is it different from or the same as the equation of exchange?arrow_forwardZbsbwhjw8272:shbwhahwh Zbsbwhjw8272:shbwhahwh Zbsbwhjw8272:shbwhahwhZbsbwhjw8272:shbwhahwhZbsbwhjw8272:shbwhahwharrow_forwardUse the Feynman technique throughout. Assume that you’re explaining the answer to someone who doesn’t know the topic at all:arrow_forward


 Economics (MindTap Course List)EconomicsISBN:9781337617383Author:Roger A. ArnoldPublisher:Cengage Learning

 Exploring EconomicsEconomicsISBN:9781544336329Author:Robert L. SextonPublisher:SAGE Publications, Inc