
Meaning of the term “holding all else equal”, and its application in the movement of
Explanation of Solution
The term is used to explain that an action takes place assuming that all the other factors, which have the potential to influence the demand and supply for a particular service or good, do not change or remain constant.
When discussing the movements in
The following graphs explain such movements along the supply curve and the demand curve, respectively.
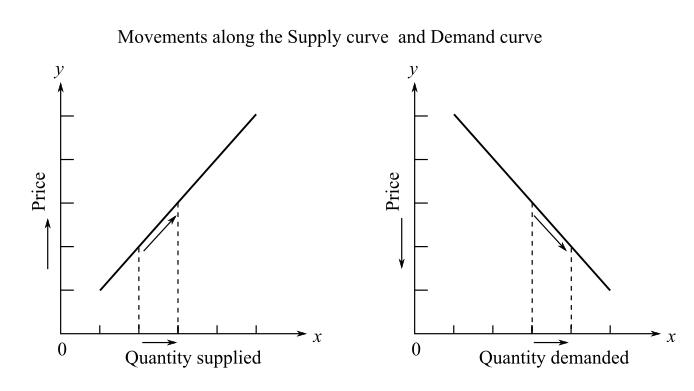
Observe the change in the price and the quantity demanded/supplied, while assuming the other factors, which have an effect on demand and supply, continue to stay the same and do not bring change in demand or supply.
An increase in price causes the supply curve to move upwards causing the supplied quantity to increase. There is a downward movement when price falls for the supply curve.
A decrease in price causes the demand curve to move downwards, which can be seen from the diagram, causing the demanded quantity to increase. The demand curve moves upwards when prices rise.
Want to see more full solutions like this?
Chapter 4 Solutions
Microeconomics (2nd Edition) (Pearson Series in Economics)

- Evaluate the effectiveness of supply and demand models in predicting labor market outcomes. Justify your assessment with specific examples from real-world labor markets.arrow_forwardExplain the difference between Microeconomics and Macroeconomics? 2.) Explain what fiscal policy is and then explain what Monetary Policy is? 3.) Why is opportunity cost and give one example from your own of opportunity cost. 4.) What are models and what model did we already discuss in class? 5.) What is meant by scarcity of resources?arrow_forward2. What is the payoff from a long futures position where you are obligated to buy at the contract price? What is the payoff from a short futures position where you are obligated to sell at the contract price?? Draw the payoff diagram for each position. Payoff from Futures Contract F=$50.85 S1 Long $100 $95 $90 $85 $80 $75 $70 $65 $60 $55 $50.85 $50 $45 $40 $35 $30 $25 Shortarrow_forward
- 3. Consider a call on the same underlier (Cisco). The strike is $50.85, which is the forward price. The owner of the call has the choice or option to buy at the strike. They get to see the market price S1 before they decide. We assume they are rational. What is the payoff from owning (also known as being long) the call? What is the payoff from selling (also known as being short) the call? Payoff from Call with Strike of k=$50.85 S1 Long $100 $95 $90 $85 $80 $75 $70 $65 $60 $55 $50.85 $50 $45 $40 $35 $30 $25 Shortarrow_forward4. Consider a put on the same underlier (Cisco). The strike is $50.85, which is the forward price. The owner of the call has the choice or option to buy at the strike. They get to see the market price S1 before they decide. We assume they are rational. What is the payoff from owning (also known as being long) the put? What is the payoff from selling (also known as being short) the put? Payoff from Put with Strike of k=$50.85 S1 Long $100 $95 $90 $85 $80 $75 $70 $65 $60 $55 $50.85 $50 $45 $40 $35 $30 $25 Shortarrow_forwardThe following table provides information on two technology companies, IBM and Cisco. Use the data to answer the following questions. Company IBM Cisco Systems Stock Price Dividend (trailing 12 months) $150.00 $50.00 $7.00 Dividend (next 12 months) $7.35 Dividend Growth 5.0% $2.00 $2.15 7.5% 1. You buy a futures contract instead of purchasing Cisco stock at $50. What is the one-year futures price, assuming the risk-free interest rate is 6%? Remember to adjust the futures price for the dividend of $2.15.arrow_forward
- 5. Consider a one-year European-style call option on Cisco stock. The strike is $50.85, which is the forward price. The risk-free interest rate is 6%. Assume the stock price either doubles or halves each period. The price movement corresponds to u = 2 and d = ½ = 1/u. S1 = $100 Call payoff= SO = $50 S1 = $25 Call payoff= What is the call payoff for $1 = $100? What is the call payoff for S1 = $25?arrow_forwardMC The diagram shows a pharmaceutical firm's demand curve and marginal cost curve for a new heart medication for which the firm holds a 20-year patent on its production. Assume this pharmaceutical firm charges a single price for its drug. At its profit-maximizing level of output, it will generate a total profit represented by OA. areas J+K. B. areas F+I+H+G+J+K OC. areas E+F+I+H+G. D. - it is not possible to determine with the informatio OE. the sum of areas A through K. (...) Po P1 Price F P2 E H 0 G B Q MR D ōarrow_forwardPrice Quantity $26 0 The marketing department of $24 20,000 Johnny Rockabilly's record company $22 40,000 has determined that the demand for his $20 60,000 latest CD is given in the table at right. $18 80,000 $16 100,000 $14 120,000 The record company's costs consist of a $240,000 fixed cost of recording the CD, an $8 per CD variable cost of producing and distributing the CD, plus the cost of paying Johnny for his creative talent. The company is considering two plans for paying Johnny. Plan 1: Johnny receives a zero fixed recording fee and a $4 per CD royalty for each CD that is sold. Plan 2: Johnny receives a $400,000 fixed recording fee and zero royalty per CD sold. Under either plan, the record company will choose the price of Johnny's CD so as to maximize its (the record company's) profit. The record company's profit is the revenues minus costs, where the costs include the costs of production, distribution, and the payment made to Johnny. Johnny's payment will be be under plan 2 as…arrow_forward
- Which of the following is the best example of perfect price discrimination? A. Universities give entry scholarships to poorer students. B. Students pay lower prices at the local theatre. ○ C. A hotel charges for its rooms according to the number of days left before the check-in date. ○ D. People who collect the mail coupons get discounts at the local food store. ○ E. An airline offers a discount to students.arrow_forwardConsider the figure at the right. The profit of the single-price monopolist OA. is shown by area D+H+I+F+A. B. is shown by area A+I+F. OC. is shown by area D + H. ○ D. is zero. ○ E. cannot be calculated or shown with just the information given in the graph. (C) Price ($) B C D H FIG шо E MC ATC A MR D = AR Quantityarrow_forwardConsider the figure. A perfectly price-discriminating monopolist will produce ○ A. 162 units and charge a price equal to $69. ○ B. 356 units and charge a price equal to $52 for the last unit sold only. OC. 162 units and charge a price equal to $52. OD. 356 units and charge a price equal to the perfectly competitive price. Dollars per Unit $69 $52 MR 162 356 Output MC Darrow_forward
 Microeconomics: Principles & PolicyEconomicsISBN:9781337794992Author:William J. Baumol, Alan S. Blinder, John L. SolowPublisher:Cengage Learning
 Economics (MindTap Course List)EconomicsISBN:9781337617383Author:Roger A. ArnoldPublisher:Cengage Learning


