
Concept explainers
Videos
For Exercises 1-14,
a. Write the domain.
b. Write the range.
c. Find the x-intercept(s).
d. Find the y-intercept.
e. Determine the asymptotes if applicable.
f. Determine the intervals over which the function is increasing.
g. Determine the intervals over which the function is decreasing.
h. Match the function with its graph.
1.
(a)
To find the domainof the function
Answer to Problem 1PRE
The domain of function
Explanation of Solution
Given: The function
Formula Used:
The domain of a function is the set of input or argument values for which the function is real and defined.
Calculation:
The function has no undefined points nor domain constraints. So, the domain will be all real numbers.
Therefore, the domain is
Conclusion:
The domain of function
(b)
To find the range of the function
Answer to Problem 1PRE
The range of function
Explanation of Solution
Given: The function
Formula Used:
The range of a function is the set of values of the dependent variable for which a function is defined.
Calculation:
Here, the function
Conclusion:
The range of function
(c)
To find x-intercept of the function
Answer to Problem 1PRE
There is no x-intercept
Explanation of Solution
Given: Function -
Formula Used:
x-intercept is a point on the graph where
Calculation:
The y-intercept of a function is obtained at the point when
But,
So, there is no such value of x which gives
Conclusion:
Hence, there are no x-axis interception points.
(d)
To find the y-intercept of the function
Answer to Problem 1PRE
The y-intercept of function
Explanation of Solution
Given: Function -
Formula Used:
y-intercept is a point on the graph where
Calculation:
Function is given as
For y-intercept,
And
Thus, y-axis interception point is
Conclusion:
The y-intercept of function
(e)
To find Asymptotes (if applicable) of the function
Answer to Problem 1PRE
There are no asymptotes of the function
Explanation of Solution
Given: Function -
Formula Used:
If
Calculation:
Given function is
There are no asymptotes as polynomial functions of degree 1 or higher can’t have asymptotes.
Conclusion:
Hence, there is no asymptote for the function
(f)
To find intervals over which the function
Answer to Problem 1PRE
Function is not an increasing function.
Explanation of Solution
Given: Function -
Formula Used:
If
Calculation:
Derivative of
Thus, the function is not increasing.
Conclusion:
Hence, function is not an increasing function
(g)
To find intervals over which the function
Answer to Problem 1PRE
Function is not a decreasing function.
Explanation of Solution
Given: Function -
Formula Used:
If
Calculation:
Derivative of
Thus, the function is not decreasing.
Conclusion:
Hence, the function is not a decreasing function
(h)
To graph the function
Explanation of Solution
Given: Function -
Graph:
Given function is
When
When
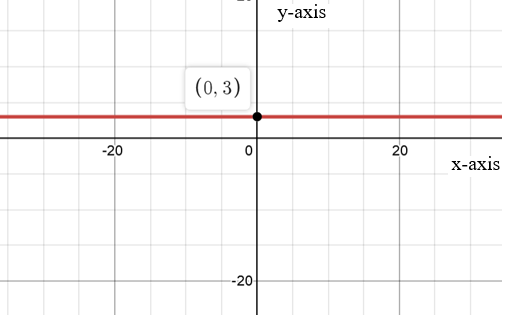
Thus, the graph is matched with the function
Want to see more full solutions like this?
Chapter 4 Solutions
College Algebra & Trigonometry - Standalone book


- Q/(a)Let X be a finite dimension vector space over a field F and S₁,S2CX such that S₁SS2. Show that whether (1) if S, is a base for X then base for X or not (2) if S2 is a base for X then S, is a base for X or not (b) Show that every subspace of vector space is convex and affine set but the conevrse need not to be true. allet M be a non-empty subset of a vector space X over a field F and x,EX. Show that M is a hyperspace iff xo+ M is a hyperplane and xo€ xo+M. bState Hahn-Banach theorem and write with prove an application about it. Show that every singleten subset and finite subset of a normed space is closed. Oxfallet f he a function from a normad roace YI Show tha ir continuour aty.GYiffarrow_forward7 3 2 x+11x+24 9 2 5 x+11x+24arrow_forward2 4 + 4x 2x 8 || 12arrow_forward
- 1 5 1 2 3 1 6 7 -4 -3 -2 -1 0 1 2 3 -1 4 Which point is not included in the solution cot for the inequality? 5arrow_forwardWhich graph represents the solution of y > x2 + 2?arrow_forwardA boat's value over time, x, is given as the function f(x) = 400(b)x. Which graph shows the boat's value decreasing at a rate of 25% per year?arrow_forward
- A boat's value over time, x, is given as the function f(x) = 400(b)x. Graph the boat's value decreasing at a rate of 25% per year?arrow_forwardDescribe the y-intercept and end behavior of the following graph: 0 2 4 -2 -4 -6arrow_forwardComputing Ending Inventory under Dollar-Value LIFO Wheels Inc. accounts for inventory using the dollar-value LIFO method. The following information is available for Year 1 through Year 3 (listed chronologically). Year Ending Inventory at FIFO Price Index Year 1 Year 2 Year 3 $6,000 1.00 9,600 1.10 12,000 1.13 Compute ending inventory under the dollar-value LIFO method for Year 1, Year 2, and Year 3. • Note: Round your answers to the nearest whole dollar.arrow_forward
- Upland Co.'s inventory records showed the following data accounted for in a perpetual inventory system. Unit Date June 1 Units Cost Inventory (beg.) 700 $8.00 June 3 Purchases 1,400 8.40 June 7 Sales (at $16 per unit) 980 952 9.00 June 20 Purchases June 22 Sales (at $16 per unit) 1,540 What is (a) ending inventory on June 30, and (b) cost of goods sold for June, using the FIFO inventory method? •Note: Do not use negative signs with any of your answers. •Note: List the inventory units in chronological order based on their purchase date with beginning inventory, if any, listed first.arrow_forwardExplain how solve 4x + 3 = 7 using the change of base formula logy: logy. Include the solution for x in your answer. Round your answer to the nearest thousandth. log barrow_forward5. Consider the following vectors 0.1 3.2 -0-0-0 = 5.4 6.0 = z= 3 0.1 For each of exercises a-e, either compute the desired quantity by hand with work shown or explain why the desired quantity is not defined. (a) 10x (b) 10-27 (c) J+Z (d) (x, y) (e) (x, z)arrow_forward
 Algebra & Trigonometry with Analytic GeometryAlgebraISBN:9781133382119Author:SwokowskiPublisher:Cengage
 Glencoe Algebra 1, Student Edition, 9780079039897...AlgebraISBN:9780079039897Author:CarterPublisher:McGraw Hill
 Trigonometry (MindTap Course List)TrigonometryISBN:9781337278461Author:Ron LarsonPublisher:Cengage Learning
 Holt Mcdougal Larson Pre-algebra: Student Edition...AlgebraISBN:9780547587776Author:HOLT MCDOUGALPublisher:HOLT MCDOUGAL