
(a)
To calculate:
The market rate of substitution between good X and Y.
Answer to Problem 1CACQ
The market rate of substitution between good X and Y is 3.
Explanation of Solution
At equilibrium, the marginal rate of substitution is equal to the ratio of prices of goods as shown below:
Therefore, market rate of substitution between good X and Y is 3.
Market Rate of Substitution: It is also known as marginal rate of substitution. It is the rate at which consumer is willing to give up of one good to get additional units of other good, maintaining constant utility.
(b)
To draw:
Consumers opportunity set diagram.
Explanation of Solution
The equation of budget line can be drawn as follows:
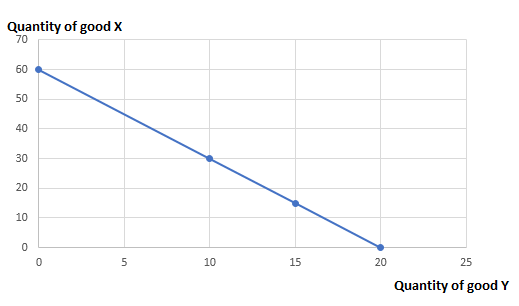
The opportunity set is shown below:
| Quantity of good X | Quantity of good Y |
| 0 | 60 |
| 10 | 30 |
| 15 | 15 |
| 20 | 0 |
Opportunity Set: It refers to the all the possible combination of goods that consumer can afford within his limited income at given prices in the market.
(c)
To draw:
Consumers opportunity set diagram when consumer income increases.
Explanation of Solution
The new budget line when consumer income when increases by $300 is shown below:
The new opportunity set is shown below:
| Quantity of good X | Quantity of good Y |
| 0 | 120 |
| 10 | 90 |
| 15 | 75 |
| 40 | 0 |
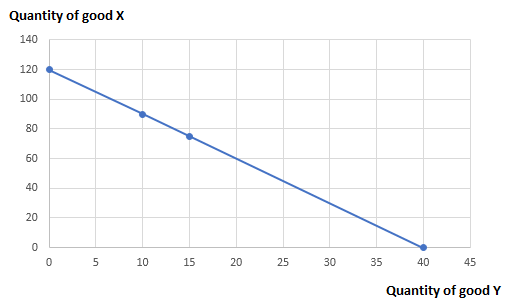
The $ 300 increase in income does not alter the market rate of substitution as MRS is the ratio of prices and independent of change in income.
Opportunity Set: It refers to the all the possible combination of goods that consumer can afford within his limited income at given prices in the market.
Want to see more full solutions like this?
Chapter 4 Solutions
Managerial Economics & Business Strategy (Mcgraw-hill Series Economics)

- a-carrow_forwardFor these questions, you must state "true," "false," or "uncertain" and argue your case (roughly 3 to 5 sentences). When appropriate, the use of graphs will make for stronger answers. Credit will depend entirely on the quality of your explanation. 1. If the industry facing regulation for its pollutant emissions has a lot of political capital, direct regulatory intervention will be more viable than an emissions tax to address this market failure. 2. A stated-preference method will provide a measure of the value of Komodo dragons that is more accurate than the value estimated through application of the travel cost model to visitation data for Komodo National Park in Indonesia. 3. A correlation between community demographics and the present location of polluting facilities is sufficient to claim a violation of distributive justice. olsvrc Q 4. When the damages from pollution are uncertain, a price-based mechanism is best equipped to manage the costs of the regulator's imperfect…arrow_forwardFor environmental economics, question number 2 only please-- thank you!arrow_forward
- For these questions, you must state "true," "false," or "uncertain" and argue your case (roughly 3 to 5 sentences). When appropriate, the use of graphs will make for stronger answers. Credit will depend entirely on the quality of your explanation. 1. If the industry facing regulation for its pollutant emissions has a lot of political capital, direct regulatory intervention will be more viable than an emissions tax to address this market failure. cullog iba linevoz ve bubivorearrow_forwardExercise 3 The production function of a firm is described by the following equation Q=10,000-3L2 where L stands for the units of labour. a) Draw a graph for this equation. Use the quantity produced in the y-axis, and the units of labour in the x-axis. b) What is the maximum production level? c) How many units of labour are needed at that point? d) Provide one reference with you answer.arrow_forwardExercise 1 Consider the market supply curve which passes through the intercept and from which the market equilibrium data is known, this is, the price and quantity of equilibrium PE=50 and QE=2000. Considering those two points, find the equation of the supply. Draw a graph of this line. Provide one reference with your answer. Exercise 2 Considering the previous supply line, determine if the following demand function corresponds to the market demand equilibrium stated above. QD=3000-2p.arrow_forward
- Consider the market supply curve which passes through the intercept and from which the marketequilibrium data is known, this is, the price and quantity of equilibrium PE=50 and QE=2000.a. Considering those two points, find the equation of the supply. b. Draw a graph of this line.arrow_forwardGovernment Purchases and Tax Revenues A B GDP T₂ Refer to the diagram. Discretionary fiscal policy designed to slow the economy is illustrated by Multiple Choice the shift of curve T₁ to T2. a movement from d to balong curve T₁.arrow_forwardSection III: Empirical Findings: Descriptive Statistics and inferential statistics………………..40% Descriptive statistics provide details about the Y variable, based on the sample for the 10-year period. Here, you use Excell or manually compute Mean or the average income per capita. Interpret the meaning of average income per capita. Draw the line chart showing the educational performance over the time-period of your study. Label the Vertical axis as Y performance and X axis as the explanatory variable (X1) . Do the same thing between Y and X2 Empirical/ Inferential Statistics: Here, use the sample information to perform the following: Draw the Scatter plot and impose the trend line: showing the Y variable and explanatory variables ( X1). Draw the scatter plot and impose the tend line: Showing Y and X2. Does your evidence (data) support your theory? Refer to the trend line: Is the relationship positive or negative as expected? Based on the data sheet below: Years Y ( per…arrow_forward
- Section III: Empirical Findings: Descriptive Statistics and inferential statistics………………..40% Descriptive statistics provide details about the Y variable, based on the sample for the 10-year period. Here, you use Excell or manually compute Mean or the average income per capita. Interpret the meaning of average income per capita. Draw the line chart showing the educational performance over the time-period of your study. Label the Vertical axis as Y performance and X axis as the explanatory variable (X1) . Do the same thing between Y and X2 Empirical/ Inferential Statistics: Here, use the sample information to perform the following: Draw the Scatter plot and impose the trend line: showing the Y variable and explanatory variables ( X1). Draw the scatter plot and impose the tend line: Showing Y and X2. Does your evidence (data) support your theory? Refer to the trend line: Is the relationship positive or negative as expected? Create graphs based on table below; Years Y ( per…arrow_forwardPlease help me with this Accounting questionarrow_forwardTitle: Does the educational performance depend on its literacy rate and government spending over the last 10 years? In the introduction, there are four things to include:a) Clearly state your research topic follows by country’s background in terms of (population density; male/female ratio; and identify the problem leading up to the study of it, such as government spending and adult literacy rate. How does the US perform compared to other countries.b) State the research question that you wish to resolve: Does the US economic performance depend on its government spending on education and the literacy rate over the last 10 years. Define performance (Y) as the average income per capita, an indicator of the country’s economy growing over time. For example, an increase in government spending leads to higher literacy rates and subsequently higher productivity in the economy. Also, mention that you will use a sample size of 10 years of secondary data from the existing literature,…arrow_forward


 Economics (MindTap Course List)EconomicsISBN:9781337617383Author:Roger A. ArnoldPublisher:Cengage Learning