
EP INTRODUCTORY STATISTICS-MYSTATLAB
3rd Edition
ISBN: 9780135190210
Author: Gould
Publisher: PEARSON CO
expand_more
expand_more
format_list_bulleted
Concept explainers
Videos
Textbook Question
Chapter 4, Problem 10SE
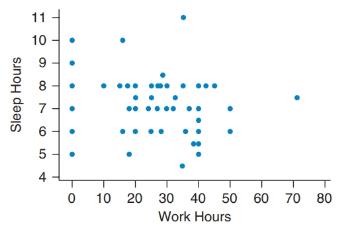
Work and Sleep The
Expert Solution & Answer
Want to see the full answer?
Check out a sample textbook solution
Students have asked these similar questions
(a) Test the hypothesis.
Consider the hypothesis test Ho
=
:
against H₁o < 02. Suppose that the sample sizes aren₁ =
7 and n₂
= 13 and that
$²
= 22.4 and $22
= 28.2. Use α = 0.05.
Ho
is not
✓ rejected.
9-9
IV
(b) Find a 95% confidence interval on of 102. Round your answer to two decimal places (e.g. 98.76).
Let us suppose we have some article reported on a study of potential sources of injury to equine veterinarians conducted at a
university veterinary hospital. Forces on the hand were measured for several common activities that veterinarians engage in when
examining or treating horses. We will consider the forces on the hands for two tasks, lifting and using ultrasound. Assume that both
sample sizes are 6, the sample mean force for lifting was 6.2 pounds with standard deviation 1.5 pounds, and the sample mean force
for using ultrasound was 6.4 pounds with standard deviation 0.3 pounds. Assume that the standard deviations are known.
Suppose that you wanted to detect a true difference in mean force of 0.25 pounds on the hands for these two activities. Under the null
hypothesis, 40 = 0. What level of type II error would you recommend here?
Round your answer to four decimal places (e.g. 98.7654). Use a
= 0.05.
β
= i
What sample size would be required?
Assume the sample sizes are to be equal.…
=
Consider the hypothesis test Ho: μ₁ = μ₂ against H₁ μ₁ μ2. Suppose that sample sizes are n₁ =
15 and n₂ =
15, that x1 = 4.7
and X2 = 7.8 and that s² = 4 and s² = 6.26. Assume that o and that the data are drawn from normal distributions. Use
απ 0.05.
(a) Test the hypothesis and find the P-value.
(b) What is the power of the test in part (a) for a true difference in means of 3?
(c) Assuming equal sample sizes, what sample size should be used to obtain ẞ = 0.05 if the true difference in means is - 2? Assume
that α = 0.05.
(a) The null hypothesis is
98.7654).
rejected. The P-value is 0.0008
(b) The power is 0.94
. Round your answer to four decimal places (e.g.
Round your answer to two decimal places (e.g. 98.76).
(c) n₁ = n2 =
1
. Round your answer to the nearest integer.
Chapter 4 Solutions
EP INTRODUCTORY STATISTICS-MYSTATLAB
Ch. 4 - GPA Predictors The scatterplots show SAT scores...Ch. 4 - Salary and Employment The first graph shows the...Ch. 4 - Age and Credits The scatterplot below shows data...Ch. 4 - Age and GPA The scatterplot shows data on age and...Ch. 4 - Credits and GPA (Example 1) The scatterplot shows...Ch. 4 - Salary and Education The scatterplot shows data on...Ch. 4 - Sisters and Brothers The scatterplot shows the...Ch. 4 - House Price and Area Describe the trend in the...Ch. 4 - Work and TV The scatterplot shows the number of...Ch. 4 - Work and Sleep The scatterplot shows the number of...
Ch. 4 - Age and Sleep The scatterplot shows the age and...Ch. 4 - Height and Weight for Women The figure shows a...Ch. 4 - College Tuition and ACT a. The first scatterplot...Ch. 4 - Ages of Women Who Give Birth The figure shows a...Ch. 4 - Law School The scatterplot shows the LSAT (Law...Ch. 4 - Medical School The scatterplot shows the...Ch. 4 - Matching Pick the letter of the graph that goes...Ch. 4 - Matching Pick the letter of the graph that goes...Ch. 4 - Matching Match each of the following correlations...Ch. 4 - Matching Match each of the following correlations...Ch. 4 - Airline Tickets (Example 2) The distance (in...Ch. 4 - Train Tickets The table for part (a) shows...Ch. 4 - SAT and GPA In Exercise 4.1 there is a graph of...Ch. 4 - House Price The correlation between house price...Ch. 4 - Rate My Professor Seth Wagerman, a former...Ch. 4 - Cousins Five people were asked how many female...Ch. 4 - GPA and Gym Use USA Today College published an...Ch. 4 - Education and Life Expectancy United Press...Ch. 4 - Salaries of College Graduates (Example 3) The...Ch. 4 - Mother and Daughter Heights The graph shows the...Ch. 4 - Median Weekly Earning by Gender The scatterplot...Ch. 4 - Home Prices and Size The scatterplot shows the...Ch. 4 - Height and Arm Span for Women (Example 4) TI-84...Ch. 4 - Hand and Foot Length for Women The computer output...Ch. 4 - Height and Arm Span for Men (Example 5)...Ch. 4 - Hand Length and Foot Length for Men Measurements...Ch. 4 - Comparing Correlation for Arm Span and Height The...Ch. 4 - Age and Weight for Men and Women The scatterplot...Ch. 4 - Singles and Doubles Winning Percentage The...Ch. 4 - Seesaw The figure shows a scatterplot of the...Ch. 4 - Choosing the Predictor and Response Variables...Ch. 4 - Choosing the Predictor and the Response Variable...Ch. 4 - Percentage of Smoke-Free Homes and Percentage of...Ch. 4 - Effect of Adult Smoking on High School Student...Ch. 4 - Car Insurance and Age The following graph shows...Ch. 4 - Life Insurance and Age The graph shows the monthly...Ch. 4 - How Is the Time of a Flight Related to the...Ch. 4 - Distance and Train Ticket Price The following...Ch. 4 - Do States with Higher Populations Have More...Ch. 4 - Movie Ratings The following table give the Rotten...Ch. 4 - Pitchers The table shows the Earned Run Average...Ch. 4 - Text Messages The following table shows the number...Ch. 4 - Answer the questions using complete sentences. a....Ch. 4 - Answer the questions using complete sentences. a....Ch. 4 - If there is a positive correlation between number...Ch. 4 - Suppose that the growth rate of children looks...Ch. 4 - Coefficient of Determination If the correlation...Ch. 4 - Coefficient of Determination Does a correlation of...Ch. 4 - Investing Some investors use a technique called...Ch. 4 - Blood Pressure Suppose a doctor telephones those...Ch. 4 - Salary and Year of Employment (Example 8) The...Ch. 4 - MPG: Highway and City The following figure shows...Ch. 4 - Cost of Turkeys The following table shows the...Ch. 4 - Wine Calories The table shows the calories in a...Ch. 4 - Teacher Pay and Expenditure Per Student (Example...Ch. 4 - Teacher Pay and High School Graduation Rates The...Ch. 4 - Does Having a Job Affect Students’ Grades?...Ch. 4 - Weight of Trash and Household Size Data were...Ch. 4 - Predicting Home Runs Data on the number of home...Ch. 4 - Predicting 3-Point Baskets Data on the 3-point...Ch. 4 - 4th-Grade Reading and Math Scores Data from the...Ch. 4 - SAT Scores The following table shows the average...Ch. 4 - Test Scores Assume that in a political science...Ch. 4 - Test Scores Assume that in a sociology class, the...Ch. 4 - Heights and Weights of People The following table...Ch. 4 - Heights and Weights of Men The table shows the...Ch. 4 - Prob. 77CRECh. 4 - Granola Bars The following table shows the fat...Ch. 4 - Shoe Size and Height The scatterplot shows the...Ch. 4 - Age and Sleep The following scatterplot shows the...Ch. 4 - Age and Weight The following scatterplot shows the...Ch. 4 - Heights and Test Scores a. The following figure...Ch. 4 - Law School Selectivity and Employment The...Ch. 4 - Prob. 84CRECh. 4 - Prob. 87CRECh. 4 - Fuel-Efficient Cars The following table gives the...Ch. 4 - Tall Buildings The following scatterplot shows...Ch. 4 - For 4.91 through 4.94 show your points in a rough...Ch. 4 - For 4.91 through 4.94 show your points in a rough...Ch. 4 - For 4.91 through 4.94 show your points in a rough...Ch. 4 - For 4.91 through 4.94 show your points in a rough...Ch. 4 - The following figure shows a scatterplot of the...Ch. 4 - Wages and Education The figure shows a scatterplot...Ch. 4 - Do Students Taking More Units Study More Hours?...Ch. 4 - Hours of Exercise and Hours of Homework The...Ch. 4 - Children’s Ages and Heights The following figure...Ch. 4 - Blackjack Tips The following figure shows the...Ch. 4 - Decrease in Cholesterol A doctor is studying...Ch. 4 - Prob. 102CRE
Additional Math Textbook Solutions
Find more solutions based on key concepts
For Problems 23-28, write in simpler form, as in Example 4. logbFG
Finite Mathematics for Business, Economics, Life Sciences and Social Sciences
The largest polynomial that divides evenly into a list of polynomials is called the _______.
Elementary & Intermediate Algebra
(a) Make a stem-and-leaf plot for these 24 observations on the number of customers who used a down-town CitiBan...
APPLIED STAT.IN BUS.+ECONOMICS
23. A plant nursery sells two sizes of oak trees to landscapers. Large trees cost the nursery $120 from the gro...
College Algebra (Collegiate Math)
Evaluate the integrals in Exercises 1–46.
1.
University Calculus: Early Transcendentals (4th Edition)
First Derivative Test a. Locale the critical points of f. b. Use the First Derivative Test to locale the local ...
Calculus: Early Transcendentals (2nd Edition)
Knowledge Booster


Learn more about
Need a deep-dive on the concept behind this application? Look no further. Learn more about this topic, statistics and related others by exploring similar questions and additional content below.Similar questions
- Consider the hypothesis test Ho: = 622 against H₁: 6 > 62. Suppose that the sample sizes are n₁ = 20 and n₂ = 8, and that = 4.5; s=2.3. Use a = 0.01. (a) Test the hypothesis. Round your answers to two decimal places (e.g. 98.76). The test statistic is fo = i The critical value is f = Conclusion: i the null hypothesis at a = 0.01. (b) Construct the confidence interval on 02/022 which can be used to test the hypothesis: (Round your answer to two decimal places (e.g. 98.76).) iarrow_forward2011 listing by carmax of the ages and prices of various corollas in a ceratin regionarrow_forwardس 11/ أ . اذا كانت 1 + x) = 2 x 3 + 2 x 2 + x) هي متعددة حدود محسوبة باستخدام طريقة الفروقات المنتهية (finite differences) من جدول البيانات التالي للدالة (f(x . احسب قيمة . ( 2 درجة ) xi k=0 k=1 k=2 k=3 0 3 1 2 2 2 3 αarrow_forward
- 1. Differentiate between discrete and continuous random variables, providing examples for each type. 2. Consider a discrete random variable representing the number of patients visiting a clinic each day. The probabilities for the number of visits are as follows: 0 visits: P(0) = 0.2 1 visit: P(1) = 0.3 2 visits: P(2) = 0.5 Using this information, calculate the expected value (mean) of the number of patient visits per day. Show all your workings clearly. Rubric to follow Definition of Random variables ( clearly and accurately differentiate between discrete and continuous random variables with appropriate examples for each) Identification of discrete random variable (correctly identifies "number of patient visits" as a discrete random variable and explains reasoning clearly.) Calculation of probabilities (uses the probabilities correctly in the calculation, showing all steps clearly and logically) Expected value calculation (calculate the expected value (mean)…arrow_forwardif the b coloumn of a z table disappeared what would be used to determine b column probabilitiesarrow_forwardConstruct a model of population flow between metropolitan and nonmetropolitan areas of a given country, given that their respective populations in 2015 were 263 million and 45 million. The probabilities are given by the following matrix. (from) (to) metro nonmetro 0.99 0.02 metro 0.01 0.98 nonmetro Predict the population distributions of metropolitan and nonmetropolitan areas for the years 2016 through 2020 (in millions, to four decimal places). (Let x, through x5 represent the years 2016 through 2020, respectively.) x₁ = x2 X3 261.27 46.73 11 259.59 48.41 11 257.96 50.04 11 256.39 51.61 11 tarrow_forward
- If the average price of a new one family home is $246,300 with a standard deviation of $15,000 find the minimum and maximum prices of the houses that a contractor will build to satisfy 88% of the market valuearrow_forward21. ANALYSIS OF LAST DIGITS Heights of statistics students were obtained by the author as part of an experiment conducted for class. The last digits of those heights are listed below. Construct a frequency distribution with 10 classes. Based on the distribution, do the heights appear to be reported or actually measured? Does there appear to be a gap in the frequencies and, if so, how might that gap be explained? What do you know about the accuracy of the results? 3 4 555 0 0 0 0 0 0 0 0 0 1 1 23 3 5 5 5 5 5 5 5 5 5 5 5 5 6 6 8 8 8 9arrow_forwardA side view of a recycling bin lid is diagramed below where two panels come together at a right angle. 45 in 24 in Width? — Given this information, how wide is the recycling bin in inches?arrow_forward
- 1 No. 2 3 4 Binomial Prob. X n P Answer 5 6 4 7 8 9 10 12345678 8 3 4 2 2552 10 0.7 0.233 0.3 0.132 7 0.6 0.290 20 0.02 0.053 150 1000 0.15 0.035 8 7 10 0.7 0.383 11 9 3 5 0.3 0.132 12 10 4 7 0.6 0.290 13 Poisson Probability 14 X lambda Answer 18 4 19 20 21 22 23 9 15 16 17 3 1234567829 3 2 0.180 2 1.5 0.251 12 10 0.095 5 3 0.101 7 4 0.060 3 2 0.180 2 1.5 0.251 24 10 12 10 0.095arrow_forwardstep by step on Microssoft on how to put this in excel and the answers please Find binomial probability if: x = 8, n = 10, p = 0.7 x= 3, n=5, p = 0.3 x = 4, n=7, p = 0.6 Quality Control: A factory produces light bulbs with a 2% defect rate. If a random sample of 20 bulbs is tested, what is the probability that exactly 2 bulbs are defective? (hint: p=2% or 0.02; x =2, n=20; use the same logic for the following problems) Marketing Campaign: A marketing company sends out 1,000 promotional emails. The probability of any email being opened is 0.15. What is the probability that exactly 150 emails will be opened? (hint: total emails or n=1000, x =150) Customer Satisfaction: A survey shows that 70% of customers are satisfied with a new product. Out of 10 randomly selected customers, what is the probability that at least 8 are satisfied? (hint: One of the keyword in this question is “at least 8”, it is not “exactly 8”, the correct formula for this should be = 1- (binom.dist(7, 10, 0.7,…arrow_forwardKate, Luke, Mary and Nancy are sharing a cake. The cake had previously been divided into four slices (s1, s2, s3 and s4). What is an example of fair division of the cake S1 S2 S3 S4 Kate $4.00 $6.00 $6.00 $4.00 Luke $5.30 $5.00 $5.25 $5.45 Mary $4.25 $4.50 $3.50 $3.75 Nancy $6.00 $4.00 $4.00 $6.00arrow_forward
arrow_back_ios
SEE MORE QUESTIONS
arrow_forward_ios
Recommended textbooks for you
 Glencoe Algebra 1, Student Edition, 9780079039897...AlgebraISBN:9780079039897Author:CarterPublisher:McGraw Hill
 Big Ideas Math A Bridge To Success Algebra 1: Stu...AlgebraISBN:9781680331141Author:HOUGHTON MIFFLIN HARCOURTPublisher:Houghton Mifflin Harcourt
 Holt Mcdougal Larson Pre-algebra: Student Edition...AlgebraISBN:9780547587776Author:HOLT MCDOUGALPublisher:HOLT MCDOUGAL
 Elementary AlgebraAlgebraISBN:9780998625713Author:Lynn Marecek, MaryAnne Anthony-SmithPublisher:OpenStax - Rice University
Glencoe Algebra 1, Student Edition, 9780079039897...
Algebra
ISBN:9780079039897
Author:Carter
Publisher:McGraw Hill
Big Ideas Math A Bridge To Success Algebra 1: Stu...
Algebra
ISBN:9781680331141
Author:HOUGHTON MIFFLIN HARCOURT
Publisher:Houghton Mifflin Harcourt
Holt Mcdougal Larson Pre-algebra: Student Edition...
Algebra
ISBN:9780547587776
Author:HOLT MCDOUGAL
Publisher:HOLT MCDOUGAL
Elementary Algebra
Algebra
ISBN:9780998625713
Author:Lynn Marecek, MaryAnne Anthony-Smith
Publisher:OpenStax - Rice University
Which is the best chart: Selecting among 14 types of charts Part II; Author: 365 Data Science;https://www.youtube.com/watch?v=qGaIB-bRn-A;License: Standard YouTube License, CC-BY