
Concept explainers
Videos
To graph: The data of the table.
Answer to Problem 33E
Explanation of Solution
Given: The populations P (in thousands) of Luxembourg for the years 1999 through 2013 are shown in the table, where t represents the year, with
Using graphing utility to find the graph of linear regression model and coefficient of determination.
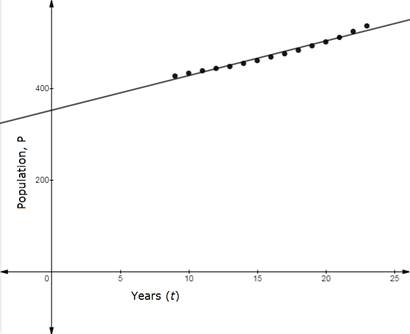
The above graph show linear model of given data.
The model is
The coefficient of determination is 0.9786
To graph: The data of the table and find the power model.
Answer to Problem 33E
Explanation of Solution
Given: The populations P (in thousands) of Luxembourg for the years 1999 through 2013 are shown in the table, where t represents the year, with
Using graphing utility to plot the points and draw the graph.
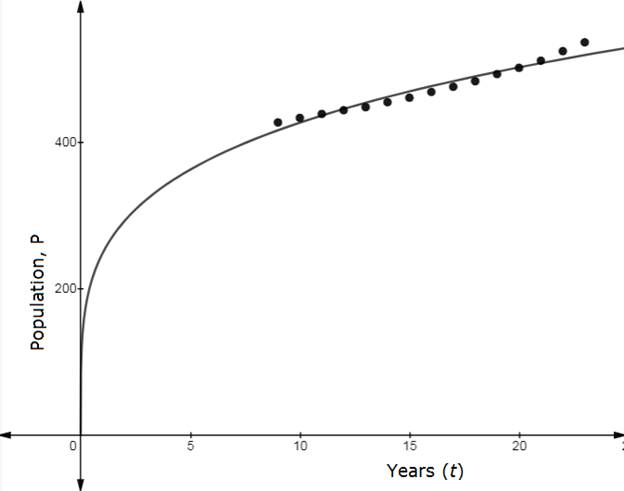
The above graph show power model of given data.
The model is
The coefficient of determination is 0.9438
To graph: The data of the table and find the exponential model.
Answer to Problem 33E
Explanation of Solution
Given: The populations P (in thousands) of Luxembourg for the years 1999 through 2013 are shown in the table, where t represents the year, with
Using graphing utility to plot the points and draw the graph.
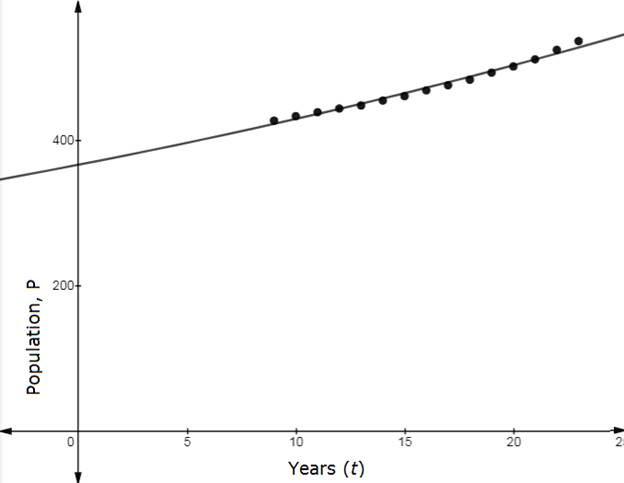
The above graph show exponential model of given data.
The model is
The coefficient of determination is 0.9866
To graph: The data of the table and find the logarithmic model.
Answer to Problem 33E
Explanation of Solution
Given: The populations P (in thousands) of Luxembourg for the years 1999 through 2013 are shown in the table, where t represents the year, with
Using graphing utility to plot the points and draw the graph.
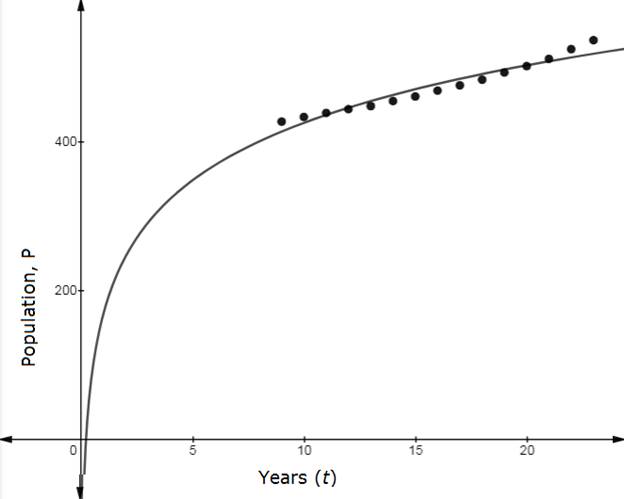
The above graph show logarithmic model of given data.
The model is
The coefficient of determination is 0.9289
To choose: The best fit model for given data.
Answer to Problem 33E
Exponential model
Explanation of Solution
Given: The populations P (in thousands) of Luxembourg for the years 1999 through 2013 are shown in the table, where t represents the year, with
There are total four different model for same data with coefficient of determination.
Linear model,
Coefficient of determination,
Power model,
Coefficient of determination,
Exponential model,
Coefficient of determination,
Logarithmic model,
Coefficient of determination,
In all above model, the best coefficient of determination nearest to 1 for exponential model.
So, choose exponential model.
To predict: The populations of Luxembourg for the years 2014 through 2018.
Answer to Problem 33E
Exponential model
Explanation of Solution
Given: The populations P (in thousands) of Luxembourg for the years 1999 through 2013 are shown in the table, where t represents the year, with
There are total four different model for same data with coefficient of determination.
Linear model,
Coefficient of determination,
Power model,
Coefficient of determination,
Exponential model,
Coefficient of determination,
Logarithmic model,
Coefficient of determination,
In all above model, the best choose exponential model.
To choose: The best model for population.
Answer to Problem 33E
Exponential model
Explanation of Solution
Given: The populations P (in thousands) of Luxembourg for the years 1999 through 2013 are shown in the table, where t represents the year, with
There are total four different model for same data with coefficient of determination.
Linear model,
Coefficient of determination,
Power model,
Coefficient of determination,
Exponential model,
Coefficient of determination,
Logarithmic model,
Coefficient of determination,
In all above model, the best choose exponential model.
To verify: The choice of model for parts (e) and (g).
Answer to Problem 33E
Exponential model
Explanation of Solution
Given: The populations P (in thousands) of Luxembourg for the years 1999 through 2013 are shown in the table, where t represents the year, with
Yes, In both parts models same. That is exponential model.
Chapter 3 Solutions
Precalculus with Limits: A Graphing Approach


- Can you answer this question and give step by step and why and how to get it. Can you write it (numerical method)arrow_forwardCan you answer this question and give step by step and why and how to get it. Can you write it (numerical method)arrow_forwardThere are three options for investing $1150. The first earns 10% compounded annually, the second earns 10% compounded quarterly, and the third earns 10% compounded continuously. Find equations that model each investment growth and use a graphing utility to graph each model in the same viewing window over a 20-year period. Use the graph to determine which investment yields the highest return after 20 years. What are the differences in earnings among the three investment? STEP 1: The formula for compound interest is A = nt = P(1 + − − ) n², where n is the number of compoundings per year, t is the number of years, r is the interest rate, P is the principal, and A is the amount (balance) after t years. For continuous compounding, the formula reduces to A = Pert Find r and n for each model, and use these values to write A in terms of t for each case. Annual Model r=0.10 A = Y(t) = 1150 (1.10)* n = 1 Quarterly Model r = 0.10 n = 4 A = Q(t) = 1150(1.025) 4t Continuous Model r=0.10 A = C(t) =…arrow_forward
- Use a graphing utility to find the point of intersection, if any, of the graphs of the functions. Round your result to three decimal places. (Enter NONE in any unused answer blanks.) y = 100e0.01x (x, y) = y = 11,250 ×arrow_forward5. For the function y-x³-3x²-1, use derivatives to: (a) determine the intervals of increase and decrease. (b) determine the local (relative) maxima and minima. (e) determine the intervals of concavity. (d) determine the points of inflection. (e) sketch the graph with the above information indicated on the graph.arrow_forwardCan you solve this 2 question numerical methodarrow_forward
- 1. Estimate the area under the graph of f(x)-25-x from x=0 to x=5 using 5 approximating rectangles Using: (A) right endpoints. (B) left endpoints.arrow_forward9. Use fundamental theorem of calculus to find the derivative d a) *dt sin(x) b)(x)√1-2 dtarrow_forward3. Evaluate the definite integral: a) √66x²+8dx b) x dx c) f*(2e* - 2)dx d) √√9-x² e) (2-5x)dx f) cos(x)dx 8)²₁₂√4-x2 h) f7dx i) f² 6xdx j) ²₂(4x+3)dxarrow_forward
- 2. Consider the integral √(2x+1)dx (a) Find the Riemann sum for this integral using right endpoints and n-4. (b) Find the Riemann sum for this same integral, using left endpoints and n=4arrow_forwardProblem 11 (a) A tank is discharging water through an orifice at a depth of T meter below the surface of the water whose area is A m². The following are the values of a for the corresponding values of A: A 1.257 1.390 x 1.50 1.65 1.520 1.650 1.809 1.962 2.123 2.295 2.462|2.650 1.80 1.95 2.10 2.25 2.40 2.55 2.70 2.85 Using the formula -3.0 (0.018)T = dx. calculate T, the time in seconds for the level of the water to drop from 3.0 m to 1.5 m above the orifice. (b) The velocity of a train which starts from rest is given by the fol- lowing table, the time being reckoned in minutes from the start and the speed in km/hour: | † (minutes) |2|4 6 8 10 12 14 16 18 20 v (km/hr) 16 28.8 40 46.4 51.2 32.0 17.6 8 3.2 0 Estimate approximately the total distance ran in 20 minutes.arrow_forwardX Solve numerically: = 0,95 In xarrow_forward
 Calculus: Early TranscendentalsCalculusISBN:9781285741550Author:James StewartPublisher:Cengage Learning
 Thomas' Calculus (14th Edition)CalculusISBN:9780134438986Author:Joel R. Hass, Christopher E. Heil, Maurice D. WeirPublisher:PEARSON
 Calculus: Early Transcendentals (3rd Edition)CalculusISBN:9780134763644Author:William L. Briggs, Lyle Cochran, Bernard Gillett, Eric SchulzPublisher:PEARSON
 Calculus: Early TranscendentalsCalculusISBN:9781319050740Author:Jon Rogawski, Colin Adams, Robert FranzosaPublisher:W. H. Freeman
 Calculus: Early Transcendental FunctionsCalculusISBN:9781337552516Author:Ron Larson, Bruce H. EdwardsPublisher:Cengage Learning