
Determinants of demand and it relevance to the equilibrium position.
Explanation of Solution
Transaction demand for money is the need for money to meet the day-to-day expenditures. It varies directly with nominal
Asset demand for money refers to the desire of public to hold money in the form of financial assets, such as stocks, bonds and so forth. If the interest rate is greater, then people would be interested to save more thereby the asset demand for money would be lower and vice versa. Thus interest rate is the major determinant of the asset demand for money.
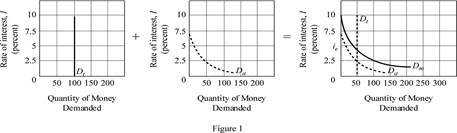
In figure -1, the horizontal axis measures quantity demanded and vertical axis measures the interest rate. The transaction demand for money, represented as Dt, is dependent only on the nominal GDP and has little effect by interest rate, so graphically it is depicted by a vertical line.
The asset demand for money, represented as Da in the figure has an inverse relation with the interest rate since it involves in the
The Total Money demand is the sum of Transaction demand and Asset demand for money
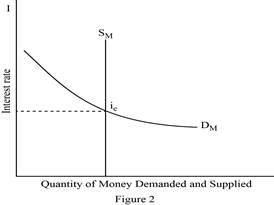
Figure- 2 depicts the equilibrium market, with quantity demanded and supplied measured in the horizontal axis and interest rate in the vertical axis.
The Monetary Authority (usually, the Central Bank of a country) decides on the Money Supply which is unaffected by the decisions that holds money for transaction or as financial asset. The Money Supply (Sm) is depicted by a vertical straight line which is independent of the rate of interest.
The Total Money demand (Dm) depends on the level of income and interest rate. It can be depicted as a linear function of income and interest rate. Demand for money varies directly with levels of income and inversely with the interest rate and slopes downward.
Dm = aY – bi
A
Dm = Sm
The interest rate at which equilibrium is made is the equilibrium interest rate (ie). Thus ie is determined at the point where Dm =Sm.
Let’s now illustrate the effect on equilibrium interest rate due to an increase in the total demand for money.
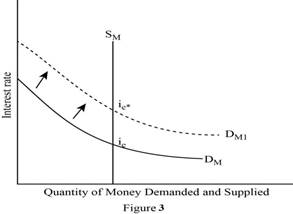
In Figure -3, the horizontal axis measures the quantity of money demanded and supplied and vertical axis represents the interest rate. When the Total money demand increases (shifts to right from DM to DM1) with money supply (SM) remaining constant, the equilibrium interest rate goes up from ie to ie*.
As the money demand increases, the previous interest rate is no longer sustainable because when the demand for money increases it exceeds the supply of money at the previous interest rate. This limits the money available to borrowers or creditors. Also there would be an upward pressure on the interest rate. Thus previous interest rate is no longer maintainable.
Concept Introduction:
Transaction demand for money: It refers to that amount of money required by individuals or firms to finance their current transaction or forthcoming expenditure.
Asset demand for money: It is the extent to which, people hold money in the form of asset.
Total Money demand: It refers to the desire of individuals or firms to hold money in the form of both financial assets and for transactions at each possible interest rate.
Equilibrium Interest rate: It is the point in which demand for money equals with the supply of money.
Want to see more full solutions like this?
Chapter 36 Solutions
ECONOMICS W/CONNECT+20 >C<

- Test Preparation QUESTION 2 [20] 2.1 Body Mass Index (BMI) is a summary measure of relative health. It is calculated by dividing an individual's weight (in kilograms) by the square of their height (in meters). A small sample was drawn from the population of UWC students to determine the effect of exercise on BMI score. Given the following table, find the constant and slope parameters of the sample regression function of BMI = f(Weekly exercise hours). Interpret the two estimated parameter values. X (Weekly exercise hours) Y (Body-Mass index) QUESTION 3 2 4 6 8 10 12 41 38 33 27 23 19 Derek investigates the relationship between the days (per year) absent from work (ABSENT) and the number of years taken for the worker to be promoted (PROMOTION). He interviewed a sample of 22 employees in Cape Town to obtain information on ABSENT (X) and PROMOTION (Y), and derived the following: ΣΧ ΣΥ 341 ΣΧΥ 176 ΣΧ 1187 1012 3.1 By using the OLS method, prove that the constant and slope parameters of the…arrow_forwardQUESTION 2 2.1 [30] Mariana, a researcher at the World Health Organisation (WHO), collects information on weekly study hours (HOURS) and blood pressure level when writing a test (BLOOD) from a sample of university students across the country, before running the regression BLOOD = f(STUDY). She collects data from 5 students as listed below: X (STUDY) 2 Y (BLOOD) 4 6 8 10 141 138 133 127 123 2.1.1 By using the OLS method and the information above derive the values for parameters B1 and B2. 2.1.2 Derive the RSS (sum of squares for the residuals). 2.1.3 Hence, calculate ô 2.2 2.3 (6) (3) Further, she replicates her study and collects data from 122 students from a rival university. She derives the residuals followed by computing skewness (S) equals -1.25 and kurtosis (K) equals 8.25 for the rival university data. Conduct the Jacque-Bera test of normality at a = 0.05. (5) Upon tasked with deriving estimates of ẞ1, B2, 82 and the standard errors (SE) of ẞ1 and B₂ for the replicated data.…arrow_forwardIf you were put in charge of ensuring that the mining industry in canada becomes more sustainable over the course of the next decade (2025-2035), how would you approach this? Come up with (at least) one resolution for each of the 4 major types of conflict: social, environmental, economic, and politicalarrow_forward
- How is the mining industry related to other Canadian labour industries? Choose one other industry, (I chose Forestry)and describe how it is related to the mining industry. How do the two industries work together? Do they ever conflict, or do they work well together?arrow_forwardWhat is the primary, secondary, tertiary, and quaternary levels of mining in Canada For each level, describe what types of careers are the most common, and describe what stage your industry’s main resource is in during that stagearrow_forwardHow does the mining industry in canada contribute to the Canadian economy? Describe why your industry is so important to the Canadian economy What would happen if your industry disappeared, or suffered significant layoffs?arrow_forward
- What is already being done to make mining in canada more sustainable? What efforts are being made in order to make mining more sustainable?arrow_forwardWhat are the environmental challenges the canadian mining industry face? Discuss current challenges that mining faces with regard to the environmentarrow_forwardWhat sustainability efforts have been put forth in the mining industry in canada Are your industry’s resources renewable or non-renewable? How do you know? Describe your industry’s reclamation processarrow_forward
- How does oligopolies practice non-price competition in South Africa?arrow_forwardWhat are the advantages and disadvantages of oligopolies on the consumers, businesses and the economy as a whole?arrow_forward1. After the reopening of borders with mainland China following the COVID-19 lockdown, residents living near the border now have the option to shop for food on either side. In Hong Kong, the cost of food is at its listed price, while across the border in mainland China, the price is only half that of Hong Kong's. A recent report indicates a decline in food sales in Hong Kong post-reopening. ** Diagrams need not be to scale; Focus on accurately representing the relevant concepts and relationships rather than the exact proportions. (a) Using a diagram, explain why Hong Kong's food sales might have dropped after the border reopening. Assume that consumers are indifferent between purchasing food in Hong Kong or mainland China, and therefore, their indifference curves have a slope of one like below. Additionally, consider that there are no transport costs and the daily food budget for consumers is identical whether they shop in Hong Kong or mainland China. I 3. 14 (b) In response to the…arrow_forward


 Economics (MindTap Course List)EconomicsISBN:9781337617383Author:Roger A. ArnoldPublisher:Cengage Learning
