
STATISTICS F/BUSINESS+ECONOMICS-TEXT
13th Edition
ISBN: 9781305881884
Author: Anderson
Publisher: CENGAGE L
expand_more
expand_more
format_list_bulleted
Concept explainers
Videos
Textbook Question
Chapter 3.5, Problem 55E
Five observations taken for two variables follow.
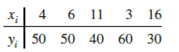
- a. Develop a scatter diagram with x on the horizontal axis.
- b. What does the scatter diagram developed in part (a) indicate about the relationship between the two variables?
- c. Compute and interpret the sample
covariance . - d. Compute and interpret the sample
correlation coefficient .
Expert Solution & Answer

Trending nowThis is a popular solution!

Students have asked these similar questions
The following data represent total ventilation measured in liters of air per minute per square meter of body area for two independent (and randomly chosen) samples.
Analyze these data using the appropriate non-parametric hypothesis test
each column represents before & after measurements on the same individual. Analyze with the appropriate non-parametric hypothesis test for a paired design.
Should you be confident in applying your regression equation to estimate the heart rate of a python at 35°C? Why or why not?
Chapter 3 Solutions
STATISTICS F/BUSINESS+ECONOMICS-TEXT
Ch. 3.1 - Consider a sample with data values of 10, 20, 12,...Ch. 3.1 - Consider a sample with data values of 10, 20, 21,...Ch. 3.1 - Consider the following data and corresponding...Ch. 3.1 - Consider the following data. Period Rate of Return...Ch. 3.1 - Consider a sample with data values of 27, 25, 20,...Ch. 3.1 - Consider a sample with data values of 53, 55, 70,...Ch. 3.1 - The average number of minutes Americans commute to...Ch. 3.1 - The Wall Street Journal reported that the median...Ch. 3.1 - Which companies spend the most money on...Ch. 3.1 - Over a nine-month period, OutdoorGearLab tested...
Ch. 3.1 - According to the National Education Association...Ch. 3.1 - The Big Bang Theory, a situation comedy featuring...Ch. 3.1 - In automobile mileage and gasoline-consumption...Ch. 3.1 - The data contained in the file named StateUnemp...Ch. 3.1 - Martinez Auto Supplies has retail stores located...Ch. 3.1 - The grade point average for college students is...Ch. 3.1 - The following table shows the total return and the...Ch. 3.1 - Based on a survey of masters programs in business...Ch. 3.1 - Annual revenue for Corning Supplies grew by 5.5%...Ch. 3.1 - Suppose that at the beginning of 2004 you invested...Ch. 3.1 - If an asset declines in value from 5000 to 3500...Ch. 3.1 - The current value of a company is 25 million. If...Ch. 3.2 - Consider a sample with data values of 10, 20, 12,...Ch. 3.2 - Consider a sample with data values of 10, 20, 12,...Ch. 3.2 - Consider a sample with data values of 27, 25, 20,...Ch. 3.2 - Data collected by the Oil Price information...Ch. 3.2 - The results of a search to find the least...Ch. 3.2 - The Australian Open is the first of the four grand...Ch. 3.2 - The Los Angeles times regularly reports the air...Ch. 3.2 - The following data were used to construct the...Ch. 3.2 - The results of Accounting Principals latest...Ch. 3.2 - Advertising age annually compiles a list of the...Ch. 3.2 - Scores turned in by an amateur golfer at the...Ch. 3.2 - The following times were recorded by the...Ch. 3.3 - Consider a sample with data values of 10, 20, 12,...Ch. 3.3 - Consider a sample with a mean of 500 and a...Ch. 3.3 - Consider a sample with a mean of 30 and a standard...Ch. 3.3 - Suppose the data have a bell-shaped distribution...Ch. 3.3 - The results of a national survey showed that on...Ch. 3.3 - The energy information Administration reported...Ch. 3.3 - The Graduate Management Admission Test (GMAT) is a...Ch. 3.3 - Many families in California are using backyard...Ch. 3.3 - According to a Los Angeles Times study of more...Ch. 3.3 - A sample of 10 NCAA college basketball game scores...Ch. 3.3 - The Wall Street Journal reported that Walmart...Ch. 3.4 - Consider a sample with data values of 27, 25, 20,...Ch. 3.4 - Prob. 47ECh. 3.4 - Prob. 48ECh. 3.4 - A data set has a first quartile of 42 and a third...Ch. 3.4 - Naples, Florida, hosts a half-marathon (13.1-mile...Ch. 3.4 - Annual sales, in millions of dollars, for 21...Ch. 3.4 - Consumer Reports provided overall customer...Ch. 3.4 - Fortune magazines list of the worlds most admired...Ch. 3.4 - The Bureau of Transportation Statistics keeps...Ch. 3.5 - Five observations taken for two variables follow....Ch. 3.5 - Five observations taken for two variables follow....Ch. 3.5 - Ten major college football bowl games were played...Ch. 3.5 - A department of transportations study on driving...Ch. 3.5 - Over the past 40 years, the percentage of homes in...Ch. 3.5 - The Russell 1000 is a stock market index...Ch. 3.5 - A random sample of 30 colleges from Kiplingers...Ch. 3 - The average number of times Americans dine out in...Ch. 3 - USA Today reports that NCAA colleges and...Ch. 3 - The average waiting time for a patient at an El...Ch. 3 - U.S. companies lose 63.2 billion per year from...Ch. 3 - A study of smartphone users shows that 68% of...Ch. 3 - Public transportation and the automobile are two...Ch. 3 - In 2007 the New York Times reported that the...Ch. 3 - The data contained in the DATAfile named...Ch. 3 - Travel + Leisure magazine provides an annual list...Ch. 3 - The 32 teams in the National Football League (NFL)...Ch. 3 - Does a major league baseball teams record during...Ch. 3 - The days to maturity for a sample of five money...Ch. 3 - Automobiles traveling on a road with a posted...Ch. 3 - The Panama Railroad Company was established in...Ch. 3 - Pelican Stores Pelican Stores, a division of...Ch. 3 - Motion Picture Industry The motion picture...Ch. 3 - Business Schools of Asia-Pacific The pursuit of a...Ch. 3 - African Elephant Populations Although millions of...
Knowledge Booster


Learn more about
Need a deep-dive on the concept behind this application? Look no further. Learn more about this topic, statistics and related others by exploring similar questions and additional content below.Similar questions
- Given your fitted regression line, what would be the residual for snake #5 (10 C)?arrow_forwardCalculate the 95% confidence interval around your estimate of r using Fisher’s z-transformation. In your final answer, make sure to back-transform to the original units.arrow_forwardCalculate Pearson’s correlation coefficient (r) between temperature and heart rate.arrow_forward
- A researcher wishes to estimate, with 90% confidence, the population proportion of adults who support labeling legislation for genetically modified organisms (GMOs). Her estimate must be accurate within 4% of the true proportion. (a) No preliminary estimate is available. Find the minimum sample size needed. (b) Find the minimum sample size needed, using a prior study that found that 65% of the respondents said they support labeling legislation for GMOs. (c) Compare the results from parts (a) and (b). ... (a) What is the minimum sample size needed assuming that no prior information is available? n = (Round up to the nearest whole number as needed.)arrow_forwardThe table available below shows the costs per mile (in cents) for a sample of automobiles. At a = 0.05, can you conclude that at least one mean cost per mile is different from the others? Click on the icon to view the data table. Let Hss, HMS, HLS, Hsuv and Hмy represent the mean costs per mile for small sedans, medium sedans, large sedans, SUV 4WDs, and minivans respectively. What are the hypotheses for this test? OA. Ho: Not all the means are equal. Ha Hss HMS HLS HSUV HMV B. Ho Hss HMS HLS HSUV = μMV Ha: Hss *HMS *HLS*HSUV * HMV C. Ho Hss HMS HLS HSUV =μMV = = H: Not all the means are equal. D. Ho Hss HMS HLS HSUV HMV Ha Hss HMS HLS =HSUV = HMVarrow_forwardQuestion: A company launches two different marketing campaigns to promote the same product in two different regions. After one month, the company collects the sales data (in units sold) from both regions to compare the effectiveness of the campaigns. The company wants to determine whether there is a significant difference in the mean sales between the two regions. Perform a two sample T-test You can provide your answer by inserting a text box and the answer must include: Null hypothesis, Alternative hypothesis, Show answer (output table/summary table), and Conclusion based on the P value. (2 points = 0.5 x 4 Answers) Each of these is worth 0.5 points. However, showing the calculation is must. If calculation is missing, the whole answer won't get any credit.arrow_forward
arrow_back_ios
SEE MORE QUESTIONS
arrow_forward_ios
Recommended textbooks for you
 Glencoe Algebra 1, Student Edition, 9780079039897...AlgebraISBN:9780079039897Author:CarterPublisher:McGraw Hill
 Big Ideas Math A Bridge To Success Algebra 1: Stu...AlgebraISBN:9781680331141Author:HOUGHTON MIFFLIN HARCOURTPublisher:Houghton Mifflin Harcourt
 Holt Mcdougal Larson Pre-algebra: Student Edition...AlgebraISBN:9780547587776Author:HOLT MCDOUGALPublisher:HOLT MCDOUGAL
Glencoe Algebra 1, Student Edition, 9780079039897...
Algebra
ISBN:9780079039897
Author:Carter
Publisher:McGraw Hill
Big Ideas Math A Bridge To Success Algebra 1: Stu...
Algebra
ISBN:9781680331141
Author:HOUGHTON MIFFLIN HARCOURT
Publisher:Houghton Mifflin Harcourt
Holt Mcdougal Larson Pre-algebra: Student Edition...
Algebra
ISBN:9780547587776
Author:HOLT MCDOUGAL
Publisher:HOLT MCDOUGAL
Correlation Vs Regression: Difference Between them with definition & Comparison Chart; Author: Key Differences;https://www.youtube.com/watch?v=Ou2QGSJVd0U;License: Standard YouTube License, CC-BY
Correlation and Regression: Concepts with Illustrative examples; Author: LEARN & APPLY : Lean and Six Sigma;https://www.youtube.com/watch?v=xTpHD5WLuoA;License: Standard YouTube License, CC-BY