Concept explainers
(a)
The rational function of the provided model. The function p ( x ) = 1.75 x 2 − 15.9 x + 160 q ( x ) = 2.1 x 2 − 3.5 x + 296

(b)
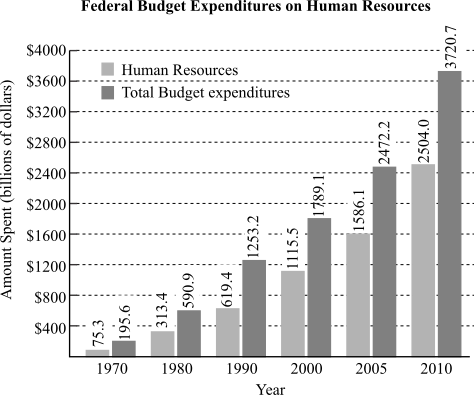
To calculate: The percentage of the federal budget spent on human resources in 2010 using the bar graph. The function

(c)
To calculate: The percentage of the federal expenditures spent on human resources in 2010 using the rational function. The function

(d)
To calculate: The equation of the horizontal asymptotes and the percentage of federal budget that will be spent on human resources over time. The function

Want to see the full answer?
Check out a sample textbook solution
Chapter 3 Solutions
Algebra and Trigonometry (6th Edition)
- Please use the infinite series formula and specify how you did each step. Thank you.arrow_forward8) Solve the given system using the Gaussian Elimination process. 2x8y = 3 (-6x+24y = −6arrow_forward7) Solve the given system using the Gaussian Elimination process. (5x-4y = 34 (2x - 2y = 14arrow_forward
- 33 (a) (b) Let A(t) = = et 0 0 0 cos(t) sin(t) 0-sin(t) cos(t)) For any fixed tЄR, find det(A(t)). Show that the matrix A(t) is invertible for any tЄ R, and find the inverse (A(t))¹.arrow_forwardUse the infinite geometric sum to convert .258 (the 58 is recurring, so there is a bar over it) to a ratio of two integers. Please go over the full problem, specifying how you found r. Thank you.arrow_forwardH.w: Find the Eigen vectors for the largest Eigen value of the system X1+ +2x3=0 3x1-2x2+x3=0 4x1+ +3x3=0arrow_forward
- need help with 5 and 6 pleasearrow_forward1) Given matrix A below, answer the following questions: a) What is the order of the matrix? b) What is the element a13? c) What is the element a₁₁? 4 -1arrow_forward[25 points] Given the vector let v = ER² and the collection of vectors ε = E-{)·()}-{☹) (9)} = {(A)·(9)}· B: = and C = · {(6)·(})}· answer the following question. (a) (b) (c) (d) (e) verify Verify is a basis for R² and find the coordinate [] of under ε. Verify B is a basis for R2 and find the coordinate []B of ʊ Verify C is a basis for R2 and find the coordinate []c of under ε. under ε. Find the change-of-basis matrix [I]+B from basis B to basis ε, and EE+BUB Find the change-of-basis matrix [I]B+ε from basis Ɛ to basis B, and verify [U]B= [] B+EVEarrow_forward
- Explain the following terms | (a) linear span (b) dimension of vector space (c) linearly independent (d) linearly dependent (e) rank of matrix Aarrow_forward3. Let u = 3/5 √ = and = -4/5 -() Define V span{ū, }. (a) (b) (c) Show that {u, } is orthonormal and forms a basis for V. Explicitly compute Projy w. Explicitly give a non-zero vector in V+.arrow_forwardIs 1.1 0.65 -3.4 0.23 0.4 -0.44 a basis for R3? You must explain your answer 0arrow_forward
 Big Ideas Math A Bridge To Success Algebra 1: Stu...AlgebraISBN:9781680331141Author:HOUGHTON MIFFLIN HARCOURTPublisher:Houghton Mifflin Harcourt
 Holt Mcdougal Larson Pre-algebra: Student Edition...AlgebraISBN:9780547587776Author:HOLT MCDOUGALPublisher:HOLT MCDOUGAL
 Glencoe Algebra 1, Student Edition, 9780079039897...AlgebraISBN:9780079039897Author:CarterPublisher:McGraw Hill

 College Algebra (MindTap Course List)AlgebraISBN:9781305652231Author:R. David Gustafson, Jeff HughesPublisher:Cengage Learning


