The bar graph shows the ratings of American Idol from season 1 (2002) through season 12 (2013). a. Let x represent American Idol’s season number and let y represent the average number of viewers, in millions. Use a graphing utility to draw a scatter plot of the data. Explain why a quadratic function is appropriate for modeling these data. b. Use the quadratic regression feature to find the quadratic function that best fits the data. Round all numbers of two decimal places. c. Use the model in part (b) to determine the season in which American Idol bad the greatest number of viewers. Round to the nearest whole number. According to the model, how many millions of viewers were there in that season? Round to one decimal place. d. how do the results obtained from the model in part (c) compare with the data displayed by the graph? e. Use a graphing utility to draw a scatter plot of the data and graph the quadratic function of best fit on the graph had the producers of American Idol looking for a shake-up? No shake-up was found and the show’s final season aired in 2016.
The bar graph shows the ratings of American Idol from season 1 (2002) through season 12 (2013). a. Let x represent American Idol’s season number and let y represent the average number of viewers, in millions. Use a graphing utility to draw a scatter plot of the data. Explain why a quadratic function is appropriate for modeling these data. b. Use the quadratic regression feature to find the quadratic function that best fits the data. Round all numbers of two decimal places. c. Use the model in part (b) to determine the season in which American Idol bad the greatest number of viewers. Round to the nearest whole number. According to the model, how many millions of viewers were there in that season? Round to one decimal place. d. how do the results obtained from the model in part (c) compare with the data displayed by the graph? e. Use a graphing utility to draw a scatter plot of the data and graph the quadratic function of best fit on the graph had the producers of American Idol looking for a shake-up? No shake-up was found and the show’s final season aired in 2016.
Solution Summary: The author explains how to graph the scatter plot of the data using a graphing utility.
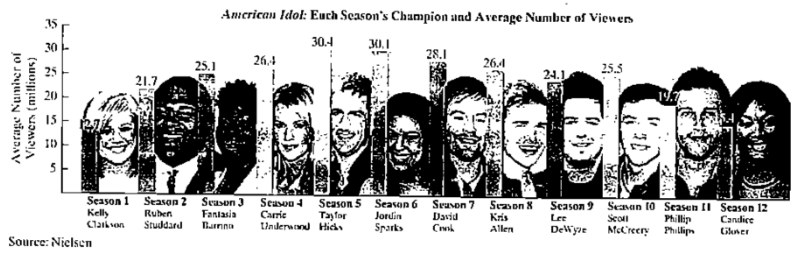
The bar graph shows the ratings of American Idol from season 1 (2002) through season 12 (2013).
a. Let x represent American Idol’s season number and let y represent the average number of viewers, in millions. Use a graphing utility to draw a scatter plot of the data.
Explain why a quadratic function is appropriate for modeling these data.
b. Use the quadratic regression feature to find the quadratic function that best fits the data. Round all numbers of two decimal places.
c. Use the model in part (b) to determine the season in which American Idol bad the greatest number of viewers. Round to the nearest whole number. According to the model, how many millions of viewers were there in that season? Round to one decimal place.
d. how do the results obtained from the model in part (c) compare with the data displayed by the graph?
e. Use a graphing utility to draw a scatter plot of the data and graph the quadratic function of best fit on the graph had the producers of American Idol looking for a shake-up? No shake-up was found and the show’s final season aired in 2016.
Formula Formula A polynomial with degree 2 is called a quadratic polynomial. A quadratic equation can be simplified to the standard form: ax² + bx + c = 0 Where, a ≠ 0. A, b, c are coefficients. c is also called "constant". 'x' is the unknown quantity
A research study in the year 2009 found that there were 2760 coyotes
in a given region. The coyote population declined at a rate of 5.8%
each year.
How many fewer coyotes were there in 2024 than in 2015?
Explain in at least one sentence how you solved the problem. Show
your work. Round your answer to the nearest whole number.
Answer the following questions related to the following matrix
A =
3
³).
Probability And Statistical Inference (10th Edition)
Knowledge Booster
Learn more about
Need a deep-dive on the concept behind this application? Look no further. Learn more about this topic, algebra and related others by exploring similar questions and additional content below.
Correlation Vs Regression: Difference Between them with definition & Comparison Chart; Author: Key Differences;https://www.youtube.com/watch?v=Ou2QGSJVd0U;License: Standard YouTube License, CC-BY
Correlation and Regression: Concepts with Illustrative examples; Author: LEARN & APPLY : Lean and Six Sigma;https://www.youtube.com/watch?v=xTpHD5WLuoA;License: Standard YouTube License, CC-BY


 Glencoe Algebra 1, Student Edition, 9780079039897...AlgebraISBN:9780079039897Author:CarterPublisher:McGraw Hill

 Big Ideas Math A Bridge To Success Algebra 1: Stu...AlgebraISBN:9781680331141Author:HOUGHTON MIFFLIN HARCOURTPublisher:Houghton Mifflin Harcourt
 Trigonometry (MindTap Course List)TrigonometryISBN:9781337278461Author:Ron LarsonPublisher:Cengage Learning