
Concept explainers
Videos
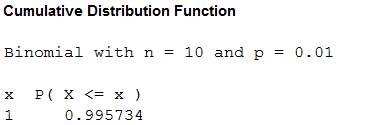
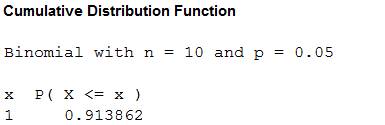
A very large batch of components has arrived at a distributor. The batch can be characterized as accept-able only if the proportion of defective components is at most .10. The distributor decides to randomly select 10 components and to accept the batch only if the number of defective components in the sample is at most 2.
- a. What is the
probability that the batch will be accepted when the actual proportion of defectives is .01? .05? .10? .20? .25? - b. Let p denote the actual proportion of defectives in the batch. A graph of P(batch is accepted) as a
function of p, with p on the horizontal axis and P(batch is accepted) on the vertical axis, is called the operating characteristic curve for the acceptance sampling plan. Use the results of part (a) to sketch this curve for 0 ≤ p ≤ 1. - c. Repeat parts (a) and (b) with “1” replacing “2” in the acceptance sampling plan.
- d. Repeat parts (a) and (b) with “15” replacing “10” in the acceptance sampling plan.
- e. Which of the three sampling plans, that of part (a), (c), or (d), appears most satisfactory, and why?
a.
Find the probability that the batch will be accepted when the actual proportion of defectives is 0.01, 0.05, 0.10, 0.20 and 0.25.
Answer to Problem 58E
The probability that the batch will be accepted for different values of actual proportion of defectives, are,
| p | |
| 0.01 | 0.998 |
| 0.05 | 0.9885 |
| 0.1 | 0.9298 |
| 0.20 | 0.6778 |
| 0.25 | 0.5256 |
Explanation of Solution
Given info:
A distributor decided to select 10 components randomly from a batch. The batch will be accepted if the number of defective components in the sample is at most 2. A batch is characterized as acceptable if the proportion of defective components is at most 0.10.
Calculation:
Let p be the actual proportion of defective in the batch.
Let X be the number of defectives in the sample.
The sample size is 10. The samples are selected randomly and the outcomes are defective or non-defective.
Hence,
It is given that the batch will be accepted if the number of defective components in the sample is at most 2 means the batch will be accepted if
The probability that the batch will be accepted when the actual proportion of defectives is p, is
The probability values:
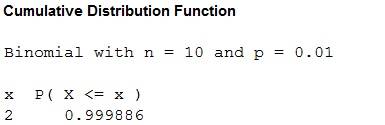
For p = 0.01:
Software procedure:
Step by step procedure to obtain the probability values using the MINITAB software:
- Choose Calc > Probability Distribution> Binomial Distribution.
- Enter number of trials as 10 and event probability as 0.01.
- Choose Cumulative probability.
- In Input constant, enter 2.
- Click OK.
Output using MINITAB software is given below:
For p = 0.05:
Software procedure:
Step by step procedure to obtain the probability values using the MINITAB software:
- Choose Calc > Probability Distribution> Binomial Distribution.
- Enter number of trials as 10 and event probability as 0.05
- Choose Cumulative probability.
- In Input constant, enter 2.
- Click OK.
Output using MINITAB software is given below:

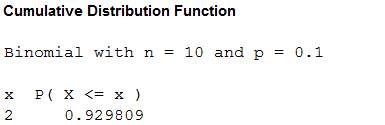
For p = 0.10:
Software procedure:
Step by step procedure to obtain the probability values using the MINITAB software:
- Choose Calc > Probability Distribution> Binomial Distribution.
- Enter number of trials as 10 and event probability as 0.10
- Choose Cumulative probability.
- In Input constant, enter 2.
- Click OK.
Output using MINITAB software is given below:
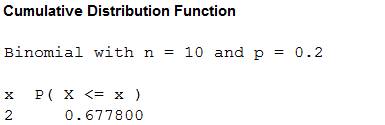
For p = 0.2:
Software procedure:
Step by step procedure to obtain the probability values using the MINITAB software:
- Choose Calc > Probability Distribution> Binomial Distribution.
- Enter number of trials as 10 and event probability as 0.20
- Choose Cumulative probability.
- In Input constant, enter 2.
- Click OK.
Output using MINITAB software is given below:
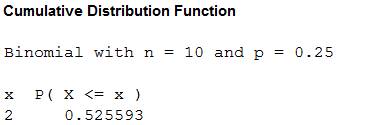
For p = 0.25:
Software procedure:
Step by step procedure to obtain the probability values using the MINITAB software:
- Choose Calc > Probability Distribution> Binomial Distribution.
- Enter number of trials as 10 and event probability as 0.25
- Choose Cumulative probability.
- In Input constant, enter 2.
- Click OK.
Output using MINITAB software is given below:
Hence, the probability that the batch will be accepted for different values of actual proportion of defectives and for
| p | |
| 0.01 | 0.998 |
| 0.05 | 0.9885 |
| 0.1 | 0.9298 |
| 0.20 | 0.6778 |
| 0.25 | 0.5256 |
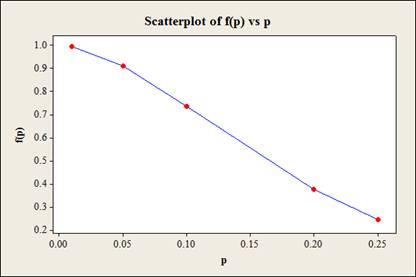
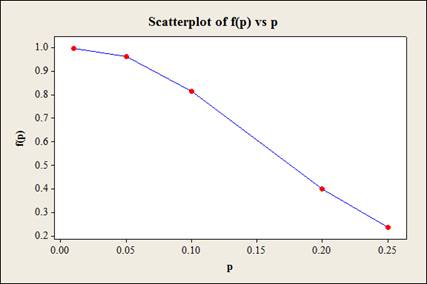
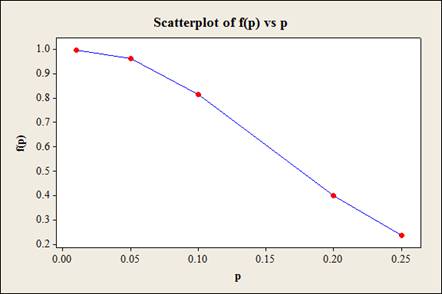
b.
Sketch the OC curve for the accepting sampling plan.
Answer to Problem 58E
The graph is given below:
Explanation of Solution
Calculation:
From part (a) it is found that, the probability that the batch will be accepted for different values of actual proportion of defectives, are,
| p | |
| 0.01 | 0.998 |
| 0.05 | 0.9885 |
| 0.1 | 0.9298 |
| 0.20 | 0.6778 |
| 0.25 | 0.5256 |
Software procedure:
Step by step procedure to obtain the probability values using the MINITAB software:
- Choose Graph > Scatterplot.
- Choose With Connect Line, and then click OK.
- Under Y variables, enter a column of f(p).
- Under X variables, enter a column of p.
- Click OK.
Output using MINITAB software is given below:
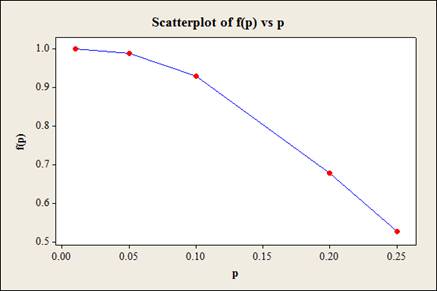
c.
Find the probability that the batch will be accepted when the actual proportion of defectives is 0.01, 0.05, 0.10, 0.20 and 0.25 with “1” replacing “2”.
Sketch the OC curve for the accepting sampling plan.
Answer to Problem 58E
The probability that the batch will be accepted when the actual proportion of defectives is 0.01, 0.05, 0.10, 0.20 and 0.25 are 0.9957, 0.9138, 0.7360, 0.3758, and 0.2440 respectively.
The OC curve is given below
Explanation of Solution
Given info:
The c value 2 is replaced by 1.
Calculation:
Let p be the actual proportion of defective in the batch.
Let X be the number of defectives in the sample.
The sample size is 10. The samples are selected randomly and the outcomes are defective or non-defective.
Hence,
It is given that the batch will be accepted if the number of defective components in the sample is at most 1 means the batch will be accepted if
The probability that the batch will be accepted when the actual proportion of defectives is p, is
The probability values:
For p = 0.01:
Software procedure:
Step by step procedure to obtain the probability values using the MINITAB software:
- Choose Calc > Probability Distribution> Binomial Distribution.
- Enter number of trials as 10 and event probability as 0.01
- Choose Cumulative probability.
- In Input constant, enter 1.
- Click OK.
Output using MINITAB software is given below:
For p = 0.05:
Software procedure:
Step by step procedure to obtain the probability values using the MINITAB software:
- Choose Calc > Probability Distribution> Binomial Distribution.
- Enter number of trials as 10 and event probability as 0.05
- Choose Cumulative probability.
- In Input constant, enter 1.
- Click OK.
Output using MINITAB software is given below:
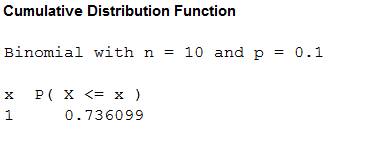
For p = 0.10:
Software procedure:
Step by step procedure to obtain the probability values using the MINITAB software:
- Choose Calc > Probability Distribution> Binomial Distribution.
- Enter number of trials as 10 and event probability as 0.10
- Choose Cumulative probability.
- In Input constant, enter 1.
- Click OK.
Output using MINITAB software is given below:
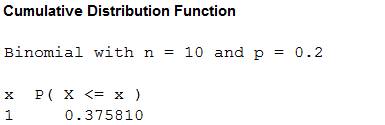
For p = 0.2:
Software procedure:
Step by step procedure to obtain the probability values using the MINITAB software:
- Choose Calc > Probability Distribution> Binomial Distribution.
- Enter number of trials as 10 and event probability as 0.20
- Choose Cumulative probability.
- In Input constant, enter 1.
- Click OK.
Output using MINITAB software is given below:
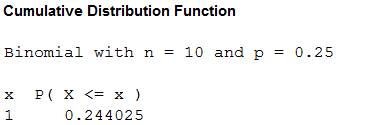
For p = 0.25:
Software procedure:
Step by step procedure to obtain the probability values using the MINITAB software:
- Choose Calc > Probability Distribution> Binomial Distribution.
- Enter number of trials as 10 and event probability as 0.25.
- Choose Cumulative probability.
- In Input constant, enter 1.
- Click OK.
Output using MINITAB software is given below:
Thus, the probability that the batch will be accepted for different values of actual proportion of defectives,
| p | |
| 0.01 | 0.9957 |
| 0.05 | 0.9138 |
| 0.1 | 0.7360 |
| 0.20 | 0.3758 |
| 0.25 | 0.2440 |
OC curve:
Software procedure:
Step by step procedure to obtain the probability values using the MINITAB software:
- Choose Graph > Scatterplot.
- Choose With Connect Line, and then click OK.
- Under Y variables, enter a column of f(p).
- Under X variables, enter a column of p.
- Click OK.
Output using MINITAB software is given below:

d.
Find the probability that the batch will be accepted when the actual proportion of defectives is 0.01, 0.05, 0.10, 0.20 and 0.25 with “15” replacing “10”.
Sketch the OC curve for the accepting sampling plan.
Answer to Problem 58E
The probability that the batch will be accepted for different values of actual proportion of defectives,
| p | |
| 0.01 | 0.996 |
| 0.05 | 0.9638 |
| 0.1 | 0.8159 |
| 0.20 | 0.3980 |
| 0.25 | 0.2360 |
The OC curve is given below
Explanation of Solution
Given info:
10 is replaced by 15.
Calculation:
Let p be the actual proportion of defective in the batch.
Let X be the number of defectives in the sample.
The sample size is 15. The samples are selected randomly and the outcomes are defective or non-defective.
Hence,
It is given that the batch will be accepted if the number of defective components in the sample is at most 2 means the batch will be accepted if
The probability that the batch will be accepted when the actual proportion of defectives is p, is
The probability values:
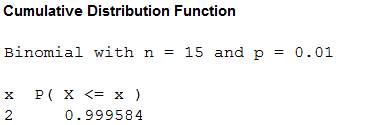
For p = 0.01:
Software procedure:
Step by step procedure to obtain the probability values using the MINITAB software:
- Choose Calc > Probability Distribution> Binomial Distribution.
- Enter number of trials as 15 and event probability as 0.01
- Choose Cumulative probability.
- In Input constant, enter 2.
- Click OK.
Output using MINITAB software is given below:
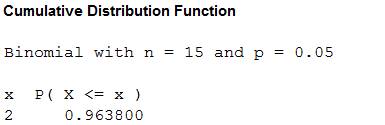
For p = 0.05:
Software procedure:
Step by step procedure to obtain the probability values using the MINITAB software:
- Choose Calc > Probability Distribution> Binomial Distribution.
- Enter number of trials as 15 and event probability as 0.05
- Choose Cumulative probability.
- In Input constant, enter 2.
- Click OK.
Output using MINITAB software is given below:
For p = 0.10:
Software procedure:
Step by step procedure to obtain the probability values using the MINITAB software:
- Choose Calc > Probability Distribution> Binomial Distribution.
- Enter number of trials as 15 and event probability as 0.10
- Choose Cumulative probability.
- In Input constant, enter 2.
- Click OK.
Output using MINITAB software is given below:
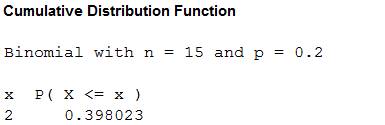
For p = 0.2:
Software procedure:
Step by step procedure to obtain the probability values using the MINITAB software:
- Choose Calc > Probability Distribution> Binomial Distribution.
- Enter number of trials as 15 and event probability as 0.20
- Choose Cumulative probability.
- In Input constant, enter 2.
- Click OK.
Output using MINITAB software is given below:
For p = 0.25:
Software procedure:
Step by step procedure to obtain the probability values using the MINITAB software:
- Choose Calc > Probability Distribution> Binomial Distribution.
- Enter number of trials as 15 and event probability as 0.25
- Choose Cumulative probability.
- In Input constant, enter 2.
- Click OK.
Output using MINITAB software is given below:
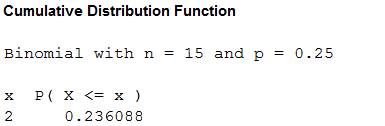
Hence, the probability that the batch will be accepted for different values of actual proportion of defectives,
| p | |
| 0.01 | 0.996 |
| 0.05 | 0.9638 |
| 0.1 | 0.8159 |
| 0.20 | 0.3980 |
| 0.25 | 0.2360 |
OC curve:
Software procedure:
Step by step procedure to obtain the probability values using the MINITAB software:
- Choose Graph > Scatterplot.
- Choose With Connect Line, and then click OK.
- Under Y variables, enter a column of f(p).
- Under X variables, enter a column of p.
- Click OK.
Output using MINITAB software is given below:
e.
Find the most satisfactory sampling plan among a, c and d.
Answer to Problem 58E
Plan in part (d) is most satisfactory.
Explanation of Solution
Justification:
It is known that a batch is characterized as acceptable if the proportion of defective components is at most 0.10 that is
Hence, the desirable probability of accepting a batch should be high when
Comparing the three sampling plan, it can be observed that for p = 0.25, the probability of accepting a batch is lowest for sampling plan in part (d) and for p = 0.01, the probability of accepting a batch is highest for sampling plan in part (d).
Hence, the sampling plan in part (d) is most satisfactory.
Want to see more full solutions like this?
Chapter 3 Solutions
PROBABILITY & STATS FOR ENGINEERING &SCI


- Clint, obviously not in college, sleeps an average of 8 hours per night with a standard deviation of 15 minutes. What's the chance of him sleeping between 7.5 and 8.5 hours on any given night? 0-(7-0) 200 91109s and doiw $20 (8-0) mol 8520 slang $199 galbrog seam side pide & D (newid se od poyesvig as PELEO PER AFTE editiw noudab temand van Czarrow_forwardTimes to complete a statistics exam have a normal distribution with a mean of 40 minutes and standard deviation of 6 minutes. Deshawn's time comes in at the 90th percentile. What percentage of the students are still working on their exams when Deshawn leaves?arrow_forwardSuppose that the weights of cereal boxes have a normal distribution with a mean of 20 ounces and standard deviation of half an ounce. A box that has a standard score of o weighs how much? syed by ilog ni 21arrow_forward
- Bob scores 80 on both his math exam (which has a mean of 70 and standard deviation of 10) and his English exam (which has a mean of 85 and standard deviation of 5). Find and interpret Bob's Z-scores on both exams to let him know which exam (if either) he did bet- ter on. Don't, however, let his parents know; let them think he's just as good at both subjects. algas 70) sering digarrow_forwardSue's math class exam has a mean of 70 with a standard deviation of 5. Her standard score is-2. What's her original exam score?arrow_forwardClint sleeps an average of 8 hours per night with a standard deviation of 15 minutes. What's the chance he will sleep less than 7.5 hours tonight? nut bow visarrow_forward
- Suppose that your score on an exam is directly at the mean. What's your standard score?arrow_forwardOne state's annual rainfall has a normal dis- tribution with a mean of 100 inches and standard deviation of 25 inches. Suppose that corn grows best when the annual rainfall is between 100 and 150 inches. What's the chance of achieving this amount of rainfall? wved now of sociarrow_forward13 Suppose that your exam score has a standard score of 0.90. Does this mean that 90 percent of the other exam scores are lower than yours?arrow_forward
- Bob's commuting times to work have a nor- mal distribution with a mean of 45 minutes and standard deviation of 10 minutes. How often does Bob get to work in 30 to 45 minutes?arrow_forwardBob's commuting times to work have a nor- mal distribution with a mean of 45 minutes and standard deviation of 10 minutes. a. What percentage of the time does Bob get to work in 30 minutes or less? b. Bob's workday starts at 9 a.m. If he leaves at 8 a.m., how often is he late?arrow_forwardSuppose that you want to put fat Fido on a weight-loss program. Before the program, his weight had a standard score of +2 com- pared to dogs of his breed/age, and after the program, his weight has a standard score of -2. His weight before the program was 150 pounds, and the standard deviation for the breed is 5 pounds. a. What's the mean weight for Fido's breed/ age? b. What's his weight after the weight-loss program?arrow_forward

 Holt Mcdougal Larson Pre-algebra: Student Edition...AlgebraISBN:9780547587776Author:HOLT MCDOUGALPublisher:HOLT MCDOUGAL
 College Algebra (MindTap Course List)AlgebraISBN:9781305652231Author:R. David Gustafson, Jeff HughesPublisher:Cengage Learning
 Algebra and Trigonometry (MindTap Course List)AlgebraISBN:9781305071742Author:James Stewart, Lothar Redlin, Saleem WatsonPublisher:Cengage Learning
 College AlgebraAlgebraISBN:9781305115545Author:James Stewart, Lothar Redlin, Saleem WatsonPublisher:Cengage Learning
 Algebra & Trigonometry with Analytic GeometryAlgebraISBN:9781133382119Author:SwokowskiPublisher:Cengage