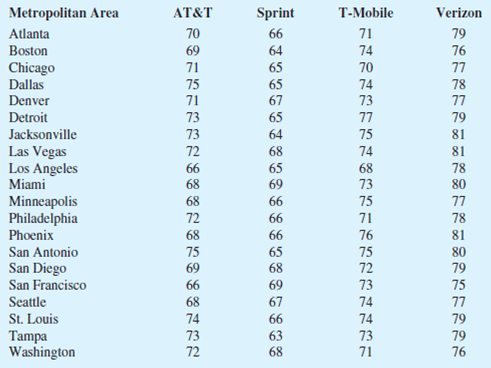
Consumer Reports provided overall customer satisfaction scores for AT&T, Sprint, T-Mobile, and Verizon cell-phone services in major metropolitan areas throughout the United States. The rating for each service reflects the overall customer satisfaction considering a variety of factors such as cost, connectivity problems, dropped calls, static interference, and customer support. A satisfaction scale from 0 to 100 was used with 0 indicating completely dissatisfied and 100 indicating completely satisfied. The ratings for the four cell-phone services in 20 metropolitan areas are as shown (Consumer Reports, January 2009).

- a. Consider T-Mobile first. What is the
median rating? - b. Develop a five-number summary for the T-Mobile service.
- c. Are there outliers for T-Mobile? explain.
- d. Repeat parts (b) and (c) for the other three cell-phone services.
- e. Show the box plots for the four cell-phone services on one graph. Discuss what a comparison of the box plots tells about the four services. Which service did Consumer Reports recommend as being best in terms of overall customer satisfaction?
Trending nowThis is a popular solution!

Chapter 3 Solutions
Statistics for Business & Economics, Revised (with XLSTAT Education Edition Printed Access Card)
- A national park conducts a study on the behaviour of their leopards. A few of the park's leopards are registered and receive a GPS device which allows measuring the position of the leopard. Use this example to describe the following concepts: population, sample, observation, value, and variable.arrow_forwardSouthwest Airlines had 81.1 million domestic boardings in a recent year, followed by Delta Airlines with 79.4 million, American Airlines with 72.6 million, United Airlines with 56.3 million, Northwest Airlines with 43.3 million, US Airways with 37.8 million, and Continental Airlines with 31.5 million, according to T-100 Domestic Market. Construct a pie chart to depict this information. List down the variable of the above data. Describe whether each variable are qualitative or quantitative data? Explain your answer. Describe the level of measurement for the variables. Explain your answer.arrow_forwardThe success of an airline depends heavily on its ability to provide a pleasant customer experience. One dimension of customer service on which airines compete is on-time arrival. The file LateFlights contains a sample of data from delayed fights showing the number of minutes each delayed fight was late for two different airlines, Deita and Southwest. Click on the datafile logo to reference the data. DATA file Delta Southwest Delta Southwest Delta Southwest Delta Southwest Delta 36 30 34 38 119 120 63 37 35 67 114 53 102 55 8 87 68 100 43 50 86 74 17 66 87 35 40 34 64 41 53 30 86 33 57 61 7. 46 52 26 70 62 75 54 80 a. Formulate the hypotheses that can be used to test for a difference between the population mean minutes late for delayed flights by these two airlines. H1= population mean minutes late for delayed Deita flights Ha= population mean minutes late for delayed Southwest flights Ho: H- 2 Select your answer H.: -a -Select your answer b. What is the sample mean number of minutes…arrow_forward
- Police Department A and Department B each use the same set of data about the number of safety violations. Department A calculates an interval of 12% to 15%, Department B calculates an interval of 10% to 17%. Which department can be more confident their interval contains the true percentage of safety violations?arrow_forwardx Resorts & Spas, a magazine devoted to upscale vacations and accommodations, published its Reader's Choice List of the top 20 independent beachfront boutique hotels in the world. The data shown are the scores received by these hotels based on the results from Resorts & Spas' annual Readers' Choice Survey. Each score represents the percentage of respondents who rated a hotel as excellent or very good on one of three criteria (comfort, amenities, and in-house dining). An overall score was also reported and used to rank the hotels. The highest ranked hotel, the Muri Beach Odyssey, has an overall score of 94.3, the highest component of which is 97.7 for in-house dining. If required, round your answer to three decimal places. Click on the datafile logo to reference the data. Hotel Overall Comfort Amenities In-House Dining Muri Beach Odyssey 94.3 94.5 90.8 97.7 Pattaya Resort 92.9 96.6 84.1 96.6 Sojourner's Respite 92.8 99.9 100.0 88.4…arrow_forwardDr. Jones conducted a study examining the relationship between the amount of sugar in a child’s diet and the activity level of the child. A sample of 30 four-year-old children from a local preschool was used in the study. Sugar consumption was measured by interviewing the parents about each child’s diet. Based on the result of the interview, each child was then placed into one of two groups: high sugar consumption and low sugar consumption. Activity level was measured by observing the children during a regular preschool afternoon. Finally, Dr. Jones compared the activity level for the high-sugar group with the activity level for the low-sugar group. Explain why Dr. Jones’ study is not an example of the experimental research strategy and provide way that it can be tested experimentally.arrow_forward
- An business reviews data on the daily amount of calls it receives. Are the data discrete or continous?arrow_forwardThe success of an airline depends heavily on its ability to provide a pleasant customer experience. One dimension of customer service on which airines compete is on-time arrival. The file LateFlights contains a sample of data from delayed fights showing the number of minutes each delayed fight was late for two dfferent airlines, Deita and Southwest. Click on the datafile logo to reference the data. DATA file Delta Southwest Delta Southwest Delta Southwest Delta Southwest Deita 36 30 34 38 119 120 63 37 35 67 114 53 102 55 8 87 68 100 43 50 86 74 17 66 87 35 40 34 64 41 53 30 86 33 57 61 7. 46 S2 26 70 62 75 54 80 a. Formulate the hypotheses that can be used to test for a difference between the population mean minutes late for delayed flights by these two airlines. 41= population mean minutes late for delayed Deita flights Ha = population mean minutes late for delayed Southwest flights Ho: H- 2Select your answer H.: -4a- Select your answer b. What is the sample mean number of minutes…arrow_forwardThe recommendations of respected wine critics have a substantial effect on the price of wine. Vintages that earn higher ratings command higher prices and spark surges in demand. These data are a random sample of ratings of wines selected from an online Web site from the 2000 and 2001 vintages. Complete parts (a) through (d). Click the icon to view the table of wine rating, price, and vintage. Yes, all the conditions are satisfied. B. No, the 2000 data contains outliers. No, the 2001 data is too skewed. D. No, the sampling procedure was not identified and it cannot be condluded that this is a simple random survey. No, the variances are drastically different. (b) Find the 95% confidence interval for the difference in average ratings in these two vintages. Does one of the years look better than the other? The 95% confidence interval for P2000 - P2001 is ( – 1.0. 1.7). (Round to one decimal place as needed.) Does one of the years look better than the other? O A. Yes, 2000 looks better…arrow_forward
- If an administrator at a regional hospital wanted to organize the following data, which chart/graph would they select, and why: a. Inpatient mortality rate (data on how many inpatients have died while in the hospital's care prior to being discharged). Sorted by first-listed diagnosis. b. Average revenue generated per physician. Sorted by physician. c. Percent of admitted patients with overnight stays compared to industry average.arrow_forwardIn a recent survey, ice cream truck drivers in Cincinnati, Ohio, reported that they make about $280 in income on a typical summer day. The income was generally higher on days with longer work hours, particularly hot days, and on holidays. The accompanying data file includes five weeks of the driver's daily income (Income), number of hours on the road (Hours), whether it was a particularly hot day (Hot - 1 if the high temperature was above 85°F, 0 otherwise), and whether it was a Holiday (Holiday = 1,0 otherwise). Click here for the Excel Data File a-1. Estimate the effect of Hours, Hot, and Holidays on Income. Report the regression coefficients and their significance at the 5% level. Note: Negative values should be indicated by a minus sign. Round your answers to 2 decimal places. Predictor Variable Constant Hours Hot Holidays Coefficient Significance at 5% Not significant Significant Significant Significantarrow_forwardThe Toyota Camry is one of the best-selling cars in North America. The cost of a previously owned Camry depends upon many factors, including the model year, mileage, and condition. To investigate the relationship between the car's mileage and the sales price for a 2007 model year Camry, the following data show the mileage and sale price for 19 sales (PriceHub website, February 24,2012). a. Develop a scatter diagram with the car mileage on the horizontal axis and the price on the vertical b. What does the scatter diagram developed in part (a) indicate about the relationship between the two variables? c. Develop the estimated regression equation that could be used to predict the price ($1000s) given the miles (1000s). d. Test for a significant relationship at the .05 level of significance. e. Did the estimated regression equation provide a good fit? Explain. f. Provide an interpretation for the slope of the estimated regression equation. g. Supposethat you are considering purchasing a…arrow_forward
 Glencoe Algebra 1, Student Edition, 9780079039897...AlgebraISBN:9780079039897Author:CarterPublisher:McGraw Hill
 Holt Mcdougal Larson Pre-algebra: Student Edition...AlgebraISBN:9780547587776Author:HOLT MCDOUGALPublisher:HOLT MCDOUGAL
 Functions and Change: A Modeling Approach to Coll...AlgebraISBN:9781337111348Author:Bruce Crauder, Benny Evans, Alan NoellPublisher:Cengage Learning
 Big Ideas Math A Bridge To Success Algebra 1: Stu...AlgebraISBN:9781680331141Author:HOUGHTON MIFFLIN HARCOURTPublisher:Houghton Mifflin Harcourt


