
Concept explainers
Videos
Energy Use The following table shows the energy use per dollar of GDP, as a percent, for years from 2000 and projected to 2035. (GDP, gross domestic product, is the monetary value of all the finished goods and services produced within a country’s borders in a specific time period, though GDP is usually calculated on an annual basis. It includes all of private and public consumption, government outlays, investments, and exports less imports that occur within a defined territory.) These data are indexed to 1980, which means that energy use for any year is viewed as a percent of the use per dollar of GDP in 1980.
a. Find a quadratic function that models these data, with x equal to the number of years after 2000 and y equal to the energy use per dollar of GDP, as a percent of the energy use per dollar of GDP in 1980. Report the model with three significant digits.
b. Graph the model and the data on the same axes.
c. Use technology to find when this model predicts that energy use per dollar of GDP will reach a minimum.
Energy Use per Dollar of GDP Indexed to 1980
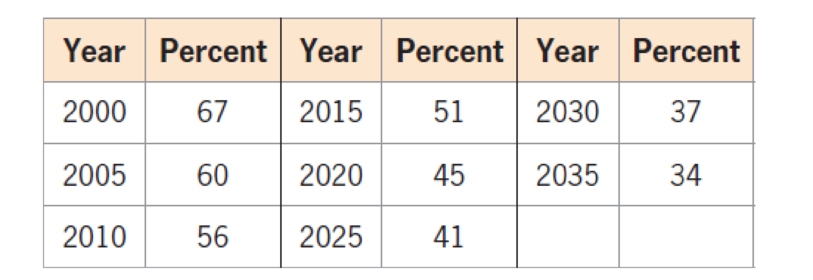
(Source: U.S. Department of Energy)
Want to see the full answer?
Check out a sample textbook solution
Chapter 3 Solutions
EBK COLLEGE ALGEBRA IN CONTEXT


- Solve the following heat equation by method of separation variables: ди = at subject to u(0,t) =0, for -16024 ძx2 • t>0, 0 0, ux (4,t) = 0, for t> 0, u(x, 0) = (x-3, \-1, 0 < x ≤2 2≤ x ≤ 4.arrow_forwardYour employer automatically puts 5 percent of your salary into a 401(k) retirement account each year. The account earns 8% interest. Suppose you just got the job, your starting salary is $40000, and you expect to receive a 2% raise each year. For simplicity, assume that interest earned and your raises are given as nominal rates and compound continuously. Find the value of your retirement account after 30 years Value = $arrow_forwardex 5. important aspects. Graph f(x)=lnx. Be sure to make your graph big enough to easily read (use the space given.) Label all 6 33arrow_forward
- Suppose that a room containing 1300 cubic feet of air is originally free of carbon monoxide (CO). Beginning at time t = 0, cigarette smoke containing 4% CO is introduced into the room at a rate of 0.8 cubic feet per minute. The well-circulated smoke and air mixture is allowed to leave the room at the same rate. Let A(t) represent the amount of CO in the room (in cubic feet) after t minutes. (A) Write the DE model for the time rate of change of CO in the room. Also state the initial condition. dA dt A(0) (B) Solve the IVP to find the amount of CO in the room at any time t > 0. A(t) (C) Extended exposure to a CO concentration as low as 0.00012 is harmful to the human body. Find the time at which this concentration is reached. t= minutesarrow_forwardNewton's Law of Cooling tells us that the rate of change of the temperature of an object is proportional to the temperature difference between the object and its surroundings. This can be modeled by the differential equation dT dt k(TA), where T is the temperature of the object after t units of time have passed, A is the ambient temperature of the object's surroundings, and k is a constant of proportionality. Suppose that a cup of coffee begins at 178 degrees and, after sitting in room temperature of 61 degrees for 12 minutes, the coffee reaches 171 degrees. How long will it take before the coffee reaches 155 degrees? Include at least 2 decimal places in your answer. minutesarrow_forwardDecide whether each limit exists. If a limit exists, estimate its value. 11. (a) lim f(x) x-3 f(x) ↑ 4 3- 2+ (b) lim f(x) x―0 -2 0 X 1234arrow_forward
- can you help me solve this question and show workings pleasearrow_forwardhow could the bar graph have been organized differently to make it easier to compare opinion changes within political partiesarrow_forwardketch a graph of the function f(x) = 3 cos (표) 6. x +1 5 4 3 3 80 9 2+ 1 -9 -8 -7 -6 -5 -4 -3 -2 -1 1 2 3 4 5 6 7 -1 -2 -3+ -4 5 -6+ Clear All Draw: пи > Next Questionarrow_forward
- Draw the following graph on the interval πT 5π < x < 2 2 y = 2 sin (2(x+7)) 6. 5. 4 3 3 2 1 +3 /2 -π/3 -π/6 π/6 π/3 π/2 2π/3 5π/6 π 7π/6 4π/3 3π/2 5π/311π/6 2π 13π/67π/3 5π Clear All Draw:arrow_forwardLet f : X → Y and g : Y → Z be two functions. Prove that(1) if g ◦ f is injective, then f is injective; (2) if g ◦ f is surjective, then g is surjective.arrow_forwardketch a graph of the function f(x) = 3 cos (표) 6. x +1 5 4 3 3 80 9 2+ 1 -9 -8 -7 -6 -5 -4 -3 -2 -1 1 2 3 4 5 6 7 -1 -2 -3+ -4 5 -6+ Clear All Draw: пи > Next Questionarrow_forward

 Trigonometry (MindTap Course List)TrigonometryISBN:9781337278461Author:Ron LarsonPublisher:Cengage Learning

 Mathematics For Machine TechnologyAdvanced MathISBN:9781337798310Author:Peterson, John.Publisher:Cengage Learning,