SAT Scores by Income The following bar graph shows U.S.math SAT scores as a function of household income: These data can be modeled by S ( x ) = 573 − 33 e − 0.0131 x where S ( x ) is the average math SAT score of students whose household income is x thousand dollars per year. Calculate lim x → + ∞ S ( x ) , and interpret the answer.
SAT Scores by Income The following bar graph shows U.S.math SAT scores as a function of household income: These data can be modeled by S ( x ) = 573 − 33 e − 0.0131 x where S ( x ) is the average math SAT score of students whose household income is x thousand dollars per year. Calculate lim x → + ∞ S ( x ) , and interpret the answer.
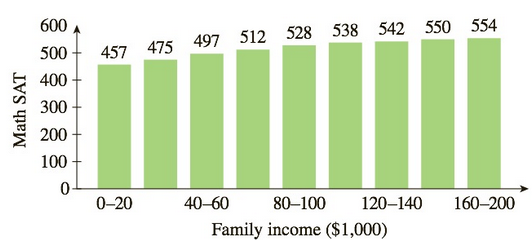
SAT Scores by Income The following bar graph shows U.S.math SAT scores as a function of household income:
These data can be modeled by
S
(
x
)
=
573
−
33
e
−
0.0131
x
where
S
(
x
)
is the average math SAT score of students whose household income is x thousand dollars per year. Calculate
lim
x
→
+
∞
S
(
x
)
, and interpret the answer.
4. [-/1 Points]
DETAILS
MY NOTES
SESSCALCET2 6.5.024.
Find the approximations Tη, Mn, and S, to the integral
computer algebra system.)
ASK YOUR TEACHER
PRACTICE ANOTHER
4 39
√
dx for n = 6 and 12. Then compute the corresponding errors ET, EM, and Es. (Round your answers to six decimal places. You may wish to use the sum command on a
n
Tn
Mn
Sp
6
12
n
ET
EM
Es
6
12
What observations can you make? In particular, what happens to the errors when n is doubled?
As n is doubled, ET and EM are decreased by a factor of about
Need Help?
Read It
'
and Es is decreased by a factor of about
6. [-/1 Points]
DETAILS
MY NOTES
SESSCALCET2 6.5.001.
ASK YOUR TEACHER
PRACTICE ANOTHER
Let I =
4
f(x) dx, where f is the function whose graph is shown.
= √ ² F(x
12
4
y
f
1
2
(a) Use the graph to find L2, R2 and M2.
42 =
R₂ =
M₂ =
1
x
3
4
Need a deep-dive on the concept behind this application? Look no further. Learn more about this topic, calculus and related others by exploring similar questions and additional content below.


 Elementary Linear Algebra (MindTap Course List)AlgebraISBN:9781305658004Author:Ron LarsonPublisher:Cengage Learning
 Algebra & Trigonometry with Analytic GeometryAlgebraISBN:9781133382119Author:SwokowskiPublisher:Cengage
 Glencoe Algebra 1, Student Edition, 9780079039897...AlgebraISBN:9780079039897Author:CarterPublisher:McGraw Hill
 Trigonometry (MindTap Course List)TrigonometryISBN:9781337278461Author:Ron LarsonPublisher:Cengage Learning