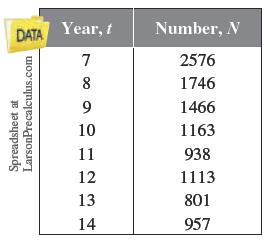
Lyme Disease The numbers N of confirmed cases of Lyme disease in Maryland from 2007 through 2014 are shown in the table, where t represents the year, with t = 7 corresponding to 2007. (a) Use a graphing utility to create a scatter plot of the data. (b) Use the regression feature of the graphing utility to find a quartic model for the data. (A quartic model has the form a t 4 + b t 3 + c t 2 + d t + e , where a , b , c , d , and e are constant and t is variable.) Graph the model in the same viewing window as the scatter plot. (c) Use the model to create a table of estimated values of N . Compare the model with the original data. (d) Use synthetic division to confirm algebraically your estimated value for the year 2014.
Lyme Disease The numbers N of confirmed cases of Lyme disease in Maryland from 2007 through 2014 are shown in the table, where t represents the year, with t = 7 corresponding to 2007. (a) Use a graphing utility to create a scatter plot of the data. (b) Use the regression feature of the graphing utility to find a quartic model for the data. (A quartic model has the form a t 4 + b t 3 + c t 2 + d t + e , where a , b , c , d , and e are constant and t is variable.) Graph the model in the same viewing window as the scatter plot. (c) Use the model to create a table of estimated values of N . Compare the model with the original data. (d) Use synthetic division to confirm algebraically your estimated value for the year 2014.
The numbers
N
of confirmed cases of Lyme disease in Maryland from 2007 through 2014 are shown in the table, where t represents the year, with
t
=
7
corresponding to 2007.
(a) Use a graphing utility to create a scatter plot of the data.
(b) Use the regression feature of the graphing utility to find a quartic model for the data. (A quartic model has the form
a
t
4
+
b
t
3
+
c
t
2
+
d
t
+
e
,
where
a
,
b
,
c
,
d
,
and
e
are constant and
t
is variable.) Graph the model in the same viewing window as the scatter plot.
(c) Use the model to create a table of estimated values of
N
.
Compare the model with the original data.
(d) Use synthetic division to confirm algebraically your estimated value for the year 2014.
Definition Definition Representation of the direction and degree of correlation in graphical form. The grouping of points that are plotted makes it a scatter diagram. A line can be drawn showing the relationship based on the direction of points and their distance from each other.
A research study in the year 2009 found that there were 2760 coyotes
in a given region. The coyote population declined at a rate of 5.8%
each year.
How many fewer coyotes were there in 2024 than in 2015?
Explain in at least one sentence how you solved the problem. Show
your work. Round your answer to the nearest whole number.
Answer the following questions related to the following matrix
A =
3
³).
Need a deep-dive on the concept behind this application? Look no further. Learn more about this topic, algebra and related others by exploring similar questions and additional content below.
01 - What Is A Differential Equation in Calculus? Learn to Solve Ordinary Differential Equations.; Author: Math and Science;https://www.youtube.com/watch?v=K80YEHQpx9g;License: Standard YouTube License, CC-BY
Higher Order Differential Equation with constant coefficient (GATE) (Part 1) l GATE 2018; Author: GATE Lectures by Dishank;https://www.youtube.com/watch?v=ODxP7BbqAjA;License: Standard YouTube License, CC-BY


 Algebra & Trigonometry with Analytic GeometryAlgebraISBN:9781133382119Author:SwokowskiPublisher:Cengage
 Elementary Linear Algebra (MindTap Course List)AlgebraISBN:9781305658004Author:Ron LarsonPublisher:Cengage Learning
 College Algebra (MindTap Course List)AlgebraISBN:9781305652231Author:R. David Gustafson, Jeff HughesPublisher:Cengage Learning