
Introduction To Statistics And Data Analysis
6th Edition
ISBN: 9781337794503
Author: PECK
Publisher: Cengage
expand_more
expand_more
format_list_bulleted
Concept explainers
Videos
Textbook Question
Chapter 3.3, Problem 36E
Use the relative frequency distribution constructed in the previous exercise to answer the following questions.
- a. Construct a cumulative relative frequency plot for the Medford rainfall data.
- b. Use the cumulative relative frequency plot of Part (a) to answer the following questions:
- i. Approximately what proportion of years had annual rainfall less than 15.5 inches?
- ii. Approximately what proportion of years had annual rainfall less than 25 inches?
- iii. Approximately what proportion of years had annual rainfall between 17.5 and 25 inches?
Example 3.19 used annual rainfall data for Albuquerque, New Mexico, to construct a relative frequency distribution and cumulative relative frequency plot. The National Climate Data Center also gave the accompanying annual rainfall (in inches) for Medford, Oregon, from 1950 to 2008.
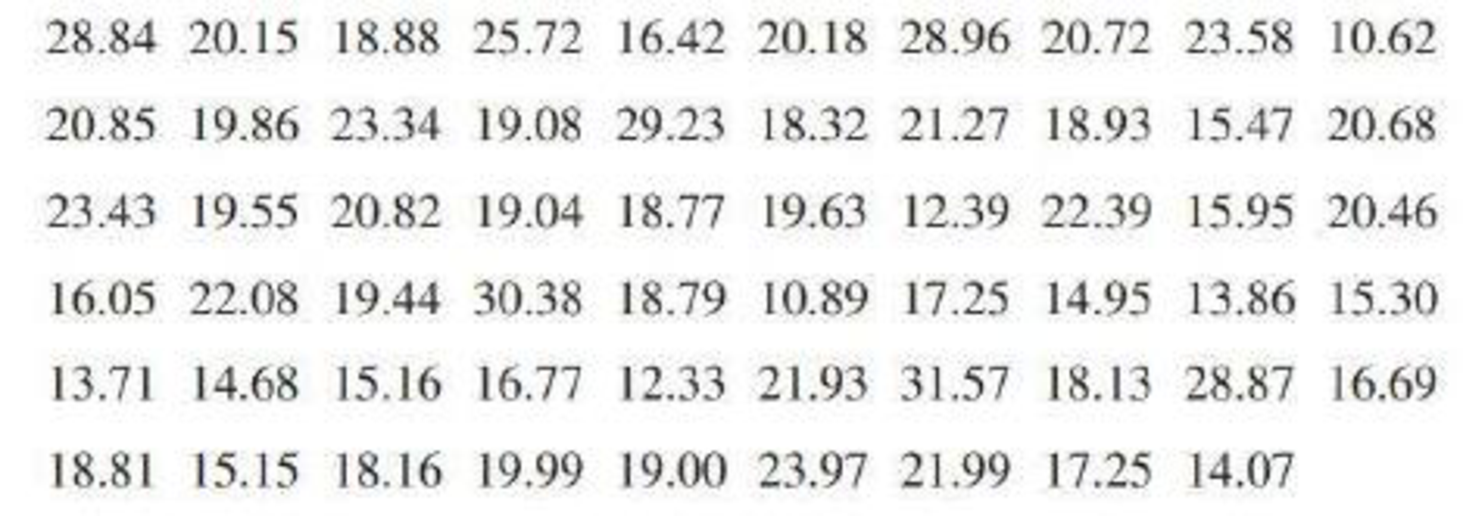
- a. Construct a relative frequency distribution for the Medford rainfall data.
- b. Use the relative frequency distribution of Part (a) to construct a histogram. Describe the shape of the histogram.
Expert Solution & Answer

Trending nowThis is a popular solution!

Students have asked these similar questions
please find the answers for the yellows boxes using the information and the picture below
A marketing agency wants to determine whether different advertising platforms generate significantly different levels of customer engagement. The agency measures the average number of daily clicks on ads for three platforms: Social Media, Search Engines, and Email Campaigns. The agency collects data on daily clicks for each platform over a 10-day period and wants to test whether there is a statistically significant difference in the mean number of daily clicks among these platforms. Conduct ANOVA test.
You can provide your answer by inserting a text box and the answer must include: also please provide a step by on getting the answers in excel
Null hypothesis,
Alternative hypothesis,
Show answer (output table/summary table), and
Conclusion based on the P value.
A company found that the daily sales revenue of its flagship product follows a normal distribution with a mean of $4500 and a standard deviation of $450. The company defines a "high-sales day" that is, any day with sales exceeding $4800. please provide a step by step on how to get the answers
Q: What percentage of days can the company expect to have "high-sales days" or sales greater than $4800?
Q: What is the sales revenue threshold for the bottom 10% of days? (please note that 10% refers to the probability/area under bell curve towards the lower tail of bell curve)
Provide answers in the yellow cells
Chapter 3 Solutions
Introduction To Statistics And Data Analysis
Ch. 3.1 - Each person in a nationally representative sample...Ch. 3.1 - The graphical display on the next page is similar...Ch. 3.1 - The survey referenced in the previous exercise was...Ch. 3.1 - The National Confectioners Association asked 1006...Ch. 3.1 - College student attitudes about e-books were...Ch. 3.1 - The Center for Science in the Public Interest...Ch. 3.1 - Using the data given in the previous exercise,...Ch. 3.1 - The article Housework around the World (USA TODAY,...Ch. 3.1 - The authors of the report Findings from the 2009...Ch. 3.1 - The survey on student attitude toward e-books...
Ch. 3.1 - During 2017, Gallup conducted a survey of adult...Ch. 3.1 - An article about college loans (New Rules Would...Ch. 3.1 - The report Findings From the 2014 College Senior...Ch. 3.2 - The National Center for Health Statistics provided...Ch. 3.2 - The paper State-Level Cancer Mortality...Ch. 3.2 - The accompanying data on seat belt use for each of...Ch. 3.2 - The previous exercise gave data on seat belt use...Ch. 3.2 - The U.S. Department of Health and Human Services...Ch. 3.2 - The article Economy Low, Generosity High (USA...Ch. 3.2 - The U.S. gasoline tax per gallon data for each of...Ch. 3.2 - A report from Texas Transportation Institute...Ch. 3.2 - The percentage of teens not in school or working...Ch. 3.3 - The data in the accompanying table are from the...Ch. 3.3 - The accompanying data on annual maximum wind speed...Ch. 3.3 - The accompanying relative frequency table is based...Ch. 3.3 - The data in the accompanying table represents the...Ch. 3.3 - Construct a histogram for the data in the previous...Ch. 3.3 - The following two relative frequency distributions...Ch. 3.3 - U.S. Census data for San Luis Obispo County,...Ch. 3.3 - Use the commute time data given in the previous...Ch. 3.3 - The report Trends in College Pricing 2012...Ch. 3.3 - An exam is given to students in an introductory...Ch. 3.3 - The accompanying frequency distribution summarizes...Ch. 3.3 - Example 3.19 used annual rainfall data for...Ch. 3.3 - Use the relative frequency distribution...Ch. 3.3 - Prob. 37ECh. 3.3 - Use the cumulative relative frequencies given in...Ch. 3.3 - Using the five class intervals 100 to 120, 120 to...Ch. 3.4 - The accompanying table gives data from a survey of...Ch. 3.4 - Consumer Reports Health (consumerreports.org) gave...Ch. 3.4 - Consumer Reports rated 29 fitness trackers (such...Ch. 3.4 - Consumer Reports (consumerreports.org) rated 37...Ch. 3.4 - The Solid Waste Management section of the...Ch. 3.4 - The report Daily Cigarette Use: Indicators on...Ch. 3.4 - The accompanying time series plot of movie box...Ch. 3.5 - The accompanying comparative bar chart is similar...Ch. 3.5 - The figure at the top left of the next page is...Ch. 3.5 - The figure at the top right of the next page is...Ch. 3.5 - The two graphical displays below are similar to...Ch. 3.5 - The following graphical display is similar to one...Ch. 3.5 - Explain why the following graphical display...Ch. 3 - Each year, The Princeton Review conducts surveys...Ch. 3 - Prob. 55CRCh. 3 - Prob. 56CRCh. 3 - Prob. 57CRCh. 3 - Prob. 58CRCh. 3 - Does the size of a transplanted organ matter? A...Ch. 3 - Prob. 60CRCh. 3 - The article Tobacco and Alcohol Use in G-Rated...Ch. 3 - Prob. 62CRCh. 3 - Prob. 63CRCh. 3 - Many nutritional experts have expressed concern...Ch. 3 - Americium 241 (241Am) is a radioactive material...Ch. 3 - Does eating broccoli reduce the risk of prostate...Ch. 3 - An article that appeared in USA TODAY (August 11,...Ch. 3 - Sometimes samples are composed entirely of...Ch. 3 - Prob. 4CRECh. 3 - More than half of Californias doctors say they are...Ch. 3 - Based on observing more than 400 drivers in the...Ch. 3 - An article from the Associated Press (May 14,...Ch. 3 - Prob. 8CRECh. 3 - Prob. 9CRECh. 3 - Prob. 10CRECh. 3 - The article Determination of Most Representative...Ch. 3 - The paper Lessons from Pacemaker Implantations...Ch. 3 - How does the speed of a runner vary over the...Ch. 3 - Prob. 14CRECh. 3 - One factor in the development of tennis elbow, a...Ch. 3 - An article that appeared in USA TODAY (September...
Additional Math Textbook Solutions
Find more solutions based on key concepts
Silvia wants to mix a 40% apple juice drink with pure apple juice to make 2 L of a juice drink that is 80% appl...
Beginning and Intermediate Algebra
First Derivative Test a. Locale the critical points of f. b. Use the First Derivative Test to locale the local ...
Calculus: Early Transcendentals (2nd Edition)
Check Your Understanding
Reading Check Complete each sentence using > or < for □.
RC1. 3 dm □ 3 dam
Basic College Mathematics
Empirical versus Theoretical A Monopoly player claims that the probability of getting a 4 when rolling a six-si...
Introductory Statistics
The largest polynomial that divides evenly into a list of polynomials is called the _______.
Elementary & Intermediate Algebra
(a) Make a stem-and-leaf plot for these 24 observations on the number of customers who used a down-town CitiBan...
APPLIED STAT.IN BUS.+ECONOMICS
Knowledge Booster


Learn more about
Need a deep-dive on the concept behind this application? Look no further. Learn more about this topic, statistics and related others by exploring similar questions and additional content below.Similar questions
- Business Discussarrow_forwardThe following data represent total ventilation measured in liters of air per minute per square meter of body area for two independent (and randomly chosen) samples. Analyze these data using the appropriate non-parametric hypothesis testarrow_forwardeach column represents before & after measurements on the same individual. Analyze with the appropriate non-parametric hypothesis test for a paired design.arrow_forward
- Should you be confident in applying your regression equation to estimate the heart rate of a python at 35°C? Why or why not?arrow_forwardGiven your fitted regression line, what would be the residual for snake #5 (10 C)?arrow_forwardCalculate the 95% confidence interval around your estimate of r using Fisher’s z-transformation. In your final answer, make sure to back-transform to the original units.arrow_forward
arrow_back_ios
SEE MORE QUESTIONS
arrow_forward_ios
Recommended textbooks for you
 Holt Mcdougal Larson Pre-algebra: Student Edition...AlgebraISBN:9780547587776Author:HOLT MCDOUGALPublisher:HOLT MCDOUGAL
 Glencoe Algebra 1, Student Edition, 9780079039897...AlgebraISBN:9780079039897Author:CarterPublisher:McGraw Hill
 Functions and Change: A Modeling Approach to Coll...AlgebraISBN:9781337111348Author:Bruce Crauder, Benny Evans, Alan NoellPublisher:Cengage Learning
 Big Ideas Math A Bridge To Success Algebra 1: Stu...AlgebraISBN:9781680331141Author:HOUGHTON MIFFLIN HARCOURTPublisher:Houghton Mifflin Harcourt
 College Algebra (MindTap Course List)AlgebraISBN:9781305652231Author:R. David Gustafson, Jeff HughesPublisher:Cengage Learning
Holt Mcdougal Larson Pre-algebra: Student Edition...
Algebra
ISBN:9780547587776
Author:HOLT MCDOUGAL
Publisher:HOLT MCDOUGAL
Glencoe Algebra 1, Student Edition, 9780079039897...
Algebra
ISBN:9780079039897
Author:Carter
Publisher:McGraw Hill
Functions and Change: A Modeling Approach to Coll...
Algebra
ISBN:9781337111348
Author:Bruce Crauder, Benny Evans, Alan Noell
Publisher:Cengage Learning
Big Ideas Math A Bridge To Success Algebra 1: Stu...
Algebra
ISBN:9781680331141
Author:HOUGHTON MIFFLIN HARCOURT
Publisher:Houghton Mifflin Harcourt
College Algebra (MindTap Course List)
Algebra
ISBN:9781305652231
Author:R. David Gustafson, Jeff Hughes
Publisher:Cengage Learning
The Shape of Data: Distributions: Crash Course Statistics #7; Author: CrashCourse;https://www.youtube.com/watch?v=bPFNxD3Yg6U;License: Standard YouTube License, CC-BY
Shape, Center, and Spread - Module 20.2 (Part 1); Author: Mrmathblog;https://www.youtube.com/watch?v=COaid7O_Gag;License: Standard YouTube License, CC-BY
Shape, Center and Spread; Author: Emily Murdock;https://www.youtube.com/watch?v=_YyW0DSCzpM;License: Standard Youtube License