
Loose Leaf Version For Elementary Statistics
3rd Edition
ISBN: 9781260373523
Author: William Navidi Prof., Barry Monk Professor
Publisher: McGraw-Hill Education
expand_more
expand_more
format_list_bulleted
Concept explainers
Videos
Textbook Question
Chapter 3.3, Problem 35E
Caffeine: Following are the number of grams of carbohydrates in 12-ounce espresso beverages offered at Starbucks.
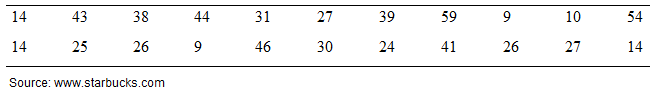
- Find the first and third
quartiles of these data. - Find the
median of these data. - Find the upper and lower outlier boundaries.
- The beverage with the most carbohydrates is a Peppermint White Chocolate Mocha, with 59 grams. Is this an outlier?
- The beverages with the least carbohydrates are an Iced Skinny Flavored Latte, and a Cappuccino, each with 9 grams. Are these outliers?
- Construct a boxplot for these data.
- Describe the shape of this distribution.
- What is the 31st percentile?
- What is the 71st percentile?
- There are 38 grams of carbohydrates in an Iced Dark Cherry Mocha. What percentile is this?
Expert Solution & Answer
Want to see the full answer?
Check out a sample textbook solution
Students have asked these similar questions
Customers experiencing technical difficulty with their Internet cable service may call an 800 number for technical support. It takes the technician between 30 seconds and 11 minutes to resolve the problem. The distribution of this support time follows the uniform distribution.
Required:
a. What are the values for a and b in minutes?
Note: Do not round your intermediate calculations. Round your answers to 1 decimal place.
b-1. What is the mean time to resolve the problem?
b-2. What is the standard deviation of the time?
c. What percent of the problems take more than 5 minutes to resolve?
d. Suppose we wish to find the middle 50% of the problem-solving times. What are the end points of these two times?
Exercise 6-6 (Algo) (LO6-3)
The director of admissions at Kinzua University in Nova Scotia estimated the distribution of student admissions for the fall semester on the basis of past experience.
Admissions
Probability
1,100
0.5
1,400
0.4
1,300
0.1
Click here for the Excel Data File
Required:
What is the expected number of admissions for the fall semester?
Compute the variance and the standard deviation of the number of admissions.
Note: Round your standard deviation to 2 decimal places.
1. Find the mean of the x-values (x-bar)
and the mean of the y-values (y-bar) and write/label each here:
2. Label the second row in the table using proper notation; then, complete the table. In the fifth and sixth
columns, show the 'products' of what you're multiplying, as well as the answers.
X
y
x minus x-bar y minus y-bar (x minus x-bar)(y minus y-bar)
(x minus x-bar)^2
xy
16
20
34
4-2
5 2
3. Write the sums that represents Sxx and Sxy in the table, at the bottom of their respective columns.
4. Find the slope of the Regression line: bi
=
(simplify your answer)
5. Find the y-intercept of the Regression line, and then write the equation of the Regression line.
Show your work. Then, BOX your final answer. Express your line as "y-hat equals...
Chapter 3 Solutions
Loose Leaf Version For Elementary Statistics
Ch. 3.1 - In Exercises 9—12, fill in each blank with the...Ch. 3.1 - In Exercises 9—12, fill in each blank with the...Ch. 3.1 - In Exercises 9—12, fill in each blank with the...Ch. 3.1 - In Exercises 9—12, fill in each blank with the...Ch. 3.1 - In Exercises 13—16, determine whether the...Ch. 3.1 - In Exercises 13—16, determine whether the...Ch. 3.1 - In Exercises 13—16, determine whether the...Ch. 3.1 - In Exercises 13—16, determine whether the...Ch. 3.1 - Find the mean, median, and mode for the following...Ch. 3.1 - Find the mean, median, and mode for the following...
Ch. 3.1 - Find the mean, median, and mode for the following...Ch. 3.1 - Find the mean, median, and mode for the following...Ch. 3.1 - In Exercises 21—24, use the given frequency...Ch. 3.1 - In Exercises 21—24, use the given frequency...Ch. 3.1 - In Exercises 21—24, use the given frequency...Ch. 3.1 - In Exercises 21—24, use the given frequency...Ch. 3.1 - Use the properties of the mean and median to...Ch. 3.1 - Use the properties of the mean and median to...Ch. 3.1 - Use the properties of the mean and median to...Ch. 3.1 - Use the properties of the mean and median to...Ch. 3.1 - Find the mean, median, and mode of the data in the...Ch. 3.1 - Find the mean, median, and mode of the data in the...Ch. 3.1 - Facebook friends: In a study of Facebook users...Ch. 3.1 - Mean and median height: The National Center for...Ch. 3.1 - Life expectancy: According to the National Vital...Ch. 3.1 - Prob. 34ECh. 3.1 - Hamburgers: An ABC News story reported the number...Ch. 3.1 - Great swimmer: In the 2016 Olympic Games, Michael...Ch. 3.1 - Mobile apps: The following table presents the...Ch. 3.1 - Prob. 38ECh. 3.1 - Whats your favorite TV show? The following tables...Ch. 3.1 - Prob. 40ECh. 3.1 - Gas prices: The following table presents the...Ch. 3.1 - Prob. 42ECh. 3.1 - Heavy football players: Following are the weights,...Ch. 3.1 - Prob. 44ECh. 3.1 - Flu season: The following tables present the...Ch. 3.1 - News flash: The following table presents the...Ch. 3.1 - Commercial break: Following are the amounts spent...Ch. 3.1 - Prob. 48ECh. 3.1 - Dont drink and drive: The Insurance Institute for...Ch. 3.1 - Prob. 50ECh. 3.1 - Be my Valentine: The following frequency...Ch. 3.1 - Get your degree: The following frequency...Ch. 3.1 - Prob. 53ECh. 3.1 - Take in a show: The following table presents the...Ch. 3.1 - Prob. 55ECh. 3.1 - Sources of news: A sample of 32 U.S. adults was...Ch. 3.1 - Find the mean: The National Center for Health...Ch. 3.1 - Find the median: According to a recent Current...Ch. 3.1 - Find the median: In a recent year, approximately...Ch. 3.1 - Find the median: The National Health and Nutrition...Ch. 3.1 - Heights: There are 2500 women and 2000 men...Ch. 3.1 - Prob. 62ECh. 3.1 - Heights: There are 35 students in a class. Fifteen...Ch. 3.1 - Prob. 64ECh. 3.1 - Prob. 65ECh. 3.1 - Prob. 66ECh. 3.1 - Whats the score? Jermaine has entered a bowling...Ch. 3.1 - Whats your grade? Addison has been told that her...Ch. 3.1 - Weighted mean: Rachel worked at three part-time...Ch. 3.1 - Weighted mean: In Jacobs statistics class, the...Ch. 3.1 - Mean or median? The Smith family in Example 3.5...Ch. 3.1 - Prob. 72ECh. 3.1 - Prob. 73ECh. 3.1 - Prob. 74ECh. 3.1 - Prob. 75ECh. 3.1 - Prob. 76ECh. 3.1 - Prob. 77ECh. 3.1 - Prob. 78ECh. 3.1 - Prob. 79ECh. 3.1 - Prob. 80ECh. 3.1 - Prob. 81ECh. 3.1 - Prob. 82ECh. 3.2 - In Exercises 11—14, fill in each blank with the...Ch. 3.2 - In Exercises 11—14, fill in each blank with the...Ch. 3.2 - In Exercises 11—14, fill in each blank with the...Ch. 3.2 - In Exercises 11—14, fill in each blank with the...Ch. 3.2 - In Exercises 15—18, determine whether the...Ch. 3.2 - In Exercises 15—18, determine whether the...Ch. 3.2 - In Exercises 15—18, determine whether the...Ch. 3.2 - In Exercises 15—18, determine whether the...Ch. 3.2 - Find the sample variance and standard deviation...Ch. 3.2 - Find the sample variance and standard deviation...Ch. 3.2 - Find the sample variance and standard deviation...Ch. 3.2 - Find the population variance and standard...Ch. 3.2 - Find the population variance and standard...Ch. 3.2 - Find the population variance and standard...Ch. 3.2 - Approximate the sample variance and standard...Ch. 3.2 - Approximate the sample variance and standard...Ch. 3.2 - Approximate the population variance and standard...Ch. 3.2 - Approximate the population variance and standard...Ch. 3.2 - Distances of the eight planets from the sun, in...Ch. 3.2 - A survey was taken in which people were asked how...Ch. 3.2 - The following TI-84 Plus display presents some...Ch. 3.2 - The following TI-84 Plus display presents some...Ch. 3.2 - The following TI-84 Plus display presents some...Ch. 3.2 - The following TI-84 Plus display presents some...Ch. 3.2 - Amazon: The following table presents the retail...Ch. 3.2 - Sports car or convertible? The following table...Ch. 3.2 - Heavy football players: Following are the weights,...Ch. 3.2 - Beer: The following table presents the number of...Ch. 3.2 - Whats your favorite TV show? The following tables...Ch. 3.2 - House prices: The following table presents prices,...Ch. 3.2 - Stock prices: Following are the closing prices of...Ch. 3.2 - Prob. 42ECh. 3.2 - Time to review: The following table presents the...Ch. 3.2 - Age distribution: The ages of residents of Banks...Ch. 3.2 - Lunch break: In a recent survey of 655 working...Ch. 3.2 - Pay your bills: In a large sample of customer...Ch. 3.2 - Newborn babies: A study conducted by the Center...Ch. 3.2 - Internet providers: In a survey of 600 homeowners...Ch. 3.2 - Lunch break: For the data in Exercise 45, estimate...Ch. 3.2 - Pay your bills: For the data in Exercise 46,...Ch. 3.2 - Newborn babies: For the data in Exercise 47,...Ch. 3.2 - Internet providers: For the data in Exercise 48,...Ch. 3.2 - Prob. 53ECh. 3.2 - Empirical Rule OK? The following histogram...Ch. 3.2 - Empirical Rule OK? The following histogram...Ch. 3.2 - Empirical Rule OK? The following histogram...Ch. 3.2 - Whats the temperature? The temperature in a...Ch. 3.2 - Find the standard deviation: The National Center...Ch. 3.2 - Find the standard deviation: The National Center...Ch. 3.2 - Price of electricity: The Energy Information...Ch. 3.2 - Possible or impossible? A data set has a mean of...Ch. 3.2 - Possible or impossible? A data set has a mean of...Ch. 3.2 - Prob. 63ECh. 3.2 - Prob. 64ECh. 3.2 - Height and weight: A Naona1 Center for Health...Ch. 3.2 - Test scores: Scores on a statistics exam had a...Ch. 3.2 - Mean absolute deviation: A measure of spread that...Ch. 3.2 - Prob. 68ECh. 3.3 - In Exercises 9—12, fill in each blank with the...Ch. 3.3 - In Exercises 9—12, fill in each blank with the...Ch. 3.3 - In Exercises 9—12, fill in each blank with the...Ch. 3.3 - In Exercises 9—12, fill in each blank with the...Ch. 3.3 - In Exercises 13—16, determine whether the...Ch. 3.3 - In Exercises 13—16, determine whether the...Ch. 3.3 - In Exercises 13—16, determine whether the...Ch. 3.3 - In Exercises 13—16, determine whether the...Ch. 3.3 - A popu1aon has mean =7 and standard deviation =2....Ch. 3.3 - A population has mean =25 and standard deviation...Ch. 3.3 - In Exercises 19 and 20, identify the outlier. Then...Ch. 3.3 - Prob. 20ECh. 3.3 - For the data set 37 82 20 25 31 10 41 44 4 36 68...Ch. 3.3 - For the data set Find the first and third...Ch. 3.3 - For the data set Find the 58th percentile. Find...Ch. 3.3 - For the data set Find the 80th percentile. Find...Ch. 3.3 - The following TI-84 Plus display presents the...Ch. 3.3 - Prob. 26ECh. 3.3 - Standardized tests: In a recent year, the mean...Ch. 3.3 - A fish story: The mean length of one-year-old...Ch. 3.3 - Blood pressure in men: The three quartiles for...Ch. 3.3 - Blood pressure in women: The article referred to...Ch. 3.3 - Hazardous waste: Following is a list of the number...Ch. 3.3 - Cholesterol levels: The National Health and...Ch. 3.3 - Commuting to work: Jamie drives to work every...Ch. 3.3 - Windy city by the bay: Following are wind speeds...Ch. 3.3 - Caffeine: Following are the number of grams of...Ch. 3.3 - Prob. 36ECh. 3.3 - Place your bets: In a recent year, 28 states in...Ch. 3.3 - Prob. 38ECh. 3.3 - Prob. 39ECh. 3.3 - Prob. 40ECh. 3.3 - Bragging rights: After learning his score on a...Ch. 3.3 - Who scored the highest? On a final exam in a large...Ch. 3.3 - Baseball salaries: In 2016, the Chicago Cubs...Ch. 3.3 - Prob. 44ECh. 3.3 - Prob. 45ECh. 3.3 - Prob. 46ECh. 3.3 - Prob. 47ECh. 3.3 - Boxplot possible? Following is the five-number...Ch. 3.3 - Unusual boxplot: Ten residents of a town were...Ch. 3.3 - Prob. 50ECh. 3.3 - Highly skewed data: Make up a data set in which...Ch. 3.3 - Highly skewed data: Make up a data set in which...Ch. 3.3 - Prob. 53ECh. 3.3 - Prob. 54ECh. 3.3 - z-scores and skewed data: Table 3.9 presents the...Ch. 3 - Of the mean, median and mode, which must be a...Ch. 3 - The prices (in dollars) for a sample of personal...Ch. 3 - Prob. 3CQCh. 3 - Prob. 4CQCh. 3 - Prob. 5CQCh. 3 - Prob. 6CQCh. 3 - Each of the following histograms represents a data...Ch. 3 - In Exercises 8—11, suppose that the mean...Ch. 3 - Prob. 9CQCh. 3 - In Exercises 8—11, suppose that the mean...Ch. 3 - Prob. 11CQCh. 3 - Prob. 12CQCh. 3 - Prob. 13CQCh. 3 - Prob. 14CQCh. 3 - Prob. 15CQCh. 3 - Prob. 1RECh. 3 - Prob. 2RECh. 3 - Prob. 3RECh. 3 - Prob. 4RECh. 3 - Prob. 5RECh. 3 - Prob. 6RECh. 3 - Measure that ball: Each of 16 students measured...Ch. 3 - Prob. 8RECh. 3 - Rivets: A machine makes rivets that are used in...Ch. 3 - Prob. 10RECh. 3 - Prob. 11RECh. 3 - Advertising costs: The amounts spent (in billions)...Ch. 3 - Prob. 13RECh. 3 - Prob. 14RECh. 3 - Prob. 15RECh. 3 - The U.S. Department of Labor annually publishes an...Ch. 3 - Explain why the Empirical Rule is more useful than...Ch. 3 - Prob. 3WAICh. 3 - Prob. 4WAICh. 3 - Percentiles are values that divide a data set into...Ch. 3 - Prob. 1CSCh. 3 - Prob. 2CSCh. 3 - Prob. 3CSCh. 3 - Prob. 4CSCh. 3 - Prob. 5CSCh. 3 - Prob. 6CSCh. 3 - Prob. 7CSCh. 3 - Prob. 8CSCh. 3 - Electronic devices contain electric circuits...
Knowledge Booster


Learn more about
Need a deep-dive on the concept behind this application? Look no further. Learn more about this topic, statistics and related others by exploring similar questions and additional content below.Similar questions
- Apply STATA commands & submit the output for each question only when indicated below i. Generate the log of birthweight and family income of children. Name these new variables Ibwght & Ifaminc. Include the output of this code. ii. Apply the command sum with the detail option to the variable faminc. Note: you should find the 25th percentile value, the 50th percentile and the 75th percentile value of faminc from the output - you will need it to answer the next question Include the output of this code. iii. iv. Use the output from part ii of this question to Generate a variable called "high_faminc" that takes a value 1 if faminc is less than or equal to the 25th percentile, it takes the value 2 if faminc is greater than 25th percentile but less than or equal to the 50th percentile, it takes the value 3 if faminc is greater than 50th percentile but less than or equal to the 75th percentile, it takes the value 4 if faminc is greater than the 75th percentile. Include the outcome of this code…arrow_forwardsolve this on paperarrow_forwardApply STATA commands & submit the output for each question only when indicated below i. Apply the command egen to create a variable called "wyd" which is the rowtotal function on variables bwght & faminc. ii. Apply the list command for the first 10 observations to show that the code in part i worked. Include the outcome of this code iii. Apply the egen command to create a new variable called "bwghtsum" using the sum function on variable bwght by the variable high_faminc (Note: need to apply the bysort' statement) iv. Apply the "by high_faminc" statement to find the V. descriptive statistics of bwght and bwghtsum Include the output of this code. Why is there a difference between the standard deviations of bwght and bwghtsum from part iv of this question?arrow_forward
- According to a health information website, the distribution of adults’ diastolic blood pressure (in millimeters of mercury, mmHg) can be modeled by a normal distribution with mean 70 mmHg and standard deviation 20 mmHg. b. Above what diastolic pressure would classify someone in the highest 1% of blood pressures? Show all calculations used.arrow_forwardWrite STATA codes which will generate the outcomes in the questions & submit the output for each question only when indicated below i. ii. iii. iv. V. Write a code which will allow STATA to go to your favorite folder to access your files. Load the birthweight1.dta dataset from your favorite folder and save it under a different filename to protect data integrity. Call the new dataset babywt.dta (make sure to use the replace option). Verify that it contains 2,998 observations and 8 variables. Include the output of this code. Are there missing observations for variable(s) for the variables called bwght, faminc, cigs? How would you know? (You may use more than one code to show your answer(s)) Include the output of your code (s). Write the definitions of these variables: bwght, faminc, male, white, motheduc,cigs; which of these variables are categorical? [Hint: use the labels of the variables & the browse command] Who is this dataset about? Who can use this dataset to answer what kind of…arrow_forwardApply STATA commands & submit the output for each question only when indicated below İ. ii. iii. iv. V. Apply the command summarize on variables bwght and faminc. What is the average birthweight of babies and family income of the respondents? Include the output of this code. Apply the tab command on the variable called male. How many of the babies and what share of babies are male? Include the output of this code. Find the summary statistics (i.e. use the sum command) of the variables bwght and faminc if the babies are white. Include the output of this code. Find the summary statistics (i.e. use the sum command) of the variables bwght and faminc if the babies are male but not white. Include the output of this code. Using your answers to previous subparts of this question: What is the difference between the average birthweight of a baby who is male and a baby who is male but not white? What can you say anything about the difference in family income of the babies that are male and male…arrow_forward
- A public health researcher is studying the impacts of nudge marketing techniques on shoppers vegetablesarrow_forwardThe director of admissions at Kinzua University in Nova Scotia estimated the distribution of student admissions for the fall semester on the basis of past experience. Admissions Probability 1,100 0.5 1,400 0.4 1,300 0.1 Click here for the Excel Data File Required: What is the expected number of admissions for the fall semester? Compute the variance and the standard deviation of the number of admissions. Note: Round your standard deviation to 2 decimal places.arrow_forwardA pollster randomly selected four of 10 available people. Required: How many different groups of 4 are possible? What is the probability that a person is a member of a group? Note: Round your answer to 3 decimal places.arrow_forward
- Wind Mountain is an archaeological study area located in southwestern New Mexico. Potsherds are broken pieces of prehistoric Native American clay vessels. One type of painted ceramic vessel is called Mimbres classic black-on-white. At three different sites the number of such sherds was counted in local dwelling excavations. Test given. Site I Site II Site III 63 19 60 43 34 21 23 49 51 48 11 15 16 46 26 20 31 Find .arrow_forwardRothamsted Experimental Station (England) has studied wheat production since 1852. Each year many small plots of equal size but different soil/fertilizer conditions are planted with wheat. At the end of the growing season, the yield (in pounds) of the wheat on the plot is measured. Suppose for a random sample of years, one plot gave the following annual wheat production (in pounds): 4.46 4.21 4.40 4.81 2.81 2.90 4.93 3.54 4.16 4.48 3.26 4.74 4.97 4.02 4.91 2.59 Use a calculator to verify that the sample variance for this plot is . Another random sample of years for a second plot gave the following annual wheat production (in pounds): 3.89 3.81 3.95 4.07 4.01 3.73 4.02 3.78 3.72 3.96 3.62 3.76 4.02 3.73 3.94 4.03 Use a calculator to verify that the sample variance for this plot is . Suppose that we test the claim using that the population variance of annual wheat production for the first plot is larger…arrow_forwardIt is thought that prehistoric Native Americans did not take their best tools, pottery, and household items when they visited higher elevations for their summer camps. It is hypothesized that archaeological sites tend to lose their cultural identity and specific cultural affiliation as the elevation of the site increases. Let x be the elevation (in thousands of feet) for an archaeological site in the southwestern United States. Let y be the percentage of unidentified artifacts (no specific cultural affiliation) at a given elevation. Suppose that the following data were obtained for a collection of archaeological sites in New Mexico: x 5.50 6.00 6.75 7.00 7.75 y 37 38 92 70 99 Find the equation of the least squares line . Round a and b to three decimal places.arrow_forward
arrow_back_ios
SEE MORE QUESTIONS
arrow_forward_ios
Recommended textbooks for you
 Big Ideas Math A Bridge To Success Algebra 1: Stu...AlgebraISBN:9781680331141Author:HOUGHTON MIFFLIN HARCOURTPublisher:Houghton Mifflin Harcourt
 Glencoe Algebra 1, Student Edition, 9780079039897...AlgebraISBN:9780079039897Author:CarterPublisher:McGraw Hill
 Holt Mcdougal Larson Pre-algebra: Student Edition...AlgebraISBN:9780547587776Author:HOLT MCDOUGALPublisher:HOLT MCDOUGAL
Big Ideas Math A Bridge To Success Algebra 1: Stu...
Algebra
ISBN:9781680331141
Author:HOUGHTON MIFFLIN HARCOURT
Publisher:Houghton Mifflin Harcourt
Glencoe Algebra 1, Student Edition, 9780079039897...
Algebra
ISBN:9780079039897
Author:Carter
Publisher:McGraw Hill
Holt Mcdougal Larson Pre-algebra: Student Edition...
Algebra
ISBN:9780547587776
Author:HOLT MCDOUGAL
Publisher:HOLT MCDOUGAL
The Shape of Data: Distributions: Crash Course Statistics #7; Author: CrashCourse;https://www.youtube.com/watch?v=bPFNxD3Yg6U;License: Standard YouTube License, CC-BY
Shape, Center, and Spread - Module 20.2 (Part 1); Author: Mrmathblog;https://www.youtube.com/watch?v=COaid7O_Gag;License: Standard YouTube License, CC-BY
Shape, Center and Spread; Author: Emily Murdock;https://www.youtube.com/watch?v=_YyW0DSCzpM;License: Standard Youtube License