
ELEMENTARY STATISTICS(LL)(FD)
3rd Edition
ISBN: 9781260707458
Author: Navidi
Publisher: MCGRAW-HILL CUSTOM PUBLISHING
expand_more
expand_more
format_list_bulleted
Concept explainers
Videos
Textbook Question
Chapter 3.3, Problem 33E
Commuting to work: Jamie drives to work every weekday morning. She keeps track of the time it takes, in minutes, for 35 days. The results follow.
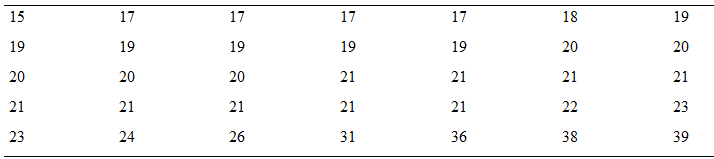
- Find the first and third
quartiles of these data. - Find the
median of these data. - Find the upper and lower outlier boundaries.
- Are there any outliers? If so, list them.
- Construct a boxplot for these data.
- Describe the shape of this distribution.
- What is the 14th percentile?
- What is the 87th percentile?
- One day, the commute time was 31 minutes. What percentile is this?
Expert Solution & Answer
Want to see the full answer?
Check out a sample textbook solution
Students have asked these similar questions
Peggy conducted a study to identify the randomness of rainy days in fall. For 15 days, she recorded whether it rained that day or not. They denoted a rainy day with the letter R, a day without rain with the letter N.
R N N R R N N R R N N R R R R
Test the sequence for randomness. Use .
Consider the grades for the math and history exams for 10 students on a scale from 0 to 12 in the following table.
Student
Math
History
1
4
8
2
5
9
3
7
9
4
12
10
5
10
8
6
8
5
7
9
6
8
9
6
9
11
9
10
7
10
Compute the Spearman correlation coefficient. Round your answer to three decimal places.
To compare two elementary schools regarding teaching of reading skills, 12 sets of identical twins were used. In each case, one child was selected at random and sent to school A, and his or her twin was sent to school B. Near the end of fifth grade, an achievement test was given to each child. The results follow:
Twin Pair
1
2
3
4
5
6
School A
169
157
115
99
119
113
School B
123
157
112
99
121
122
Twin Pair
7
8
9
10
11
12
School A
120
121
124
145
138
117
School B
153
90
124
140
142
102
Suppose a sign test for matched pairs with a 1% level of significance is used to test the hypothesis that the schools have the same effectiveness in teaching reading skills against the alternate hypothesis that the schools have different levels of effectiveness in teaching reading skills. Let p denote portion of positive signs when the scores of school B are subtracted from the corresponding scores of school…
Chapter 3 Solutions
ELEMENTARY STATISTICS(LL)(FD)
Ch. 3.1 - In Exercises 9—12, fill in each blank with the...Ch. 3.1 - In Exercises 9—12, fill in each blank with the...Ch. 3.1 - In Exercises 9—12, fill in each blank with the...Ch. 3.1 - In Exercises 9—12, fill in each blank with the...Ch. 3.1 - In Exercises 13—16, determine whether the...Ch. 3.1 - In Exercises 13—16, determine whether the...Ch. 3.1 - In Exercises 13—16, determine whether the...Ch. 3.1 - In Exercises 13—16, determine whether the...Ch. 3.1 - Find the mean, median, and mode for the following...Ch. 3.1 - Find the mean, median, and mode for the following...
Ch. 3.1 - Find the mean, median, and mode for the following...Ch. 3.1 - Find the mean, median, and mode for the following...Ch. 3.1 - In Exercises 21—24, use the given frequency...Ch. 3.1 - In Exercises 21—24, use the given frequency...Ch. 3.1 - In Exercises 21—24, use the given frequency...Ch. 3.1 - In Exercises 21—24, use the given frequency...Ch. 3.1 - Use the properties of the mean and median to...Ch. 3.1 - Use the properties of the mean and median to...Ch. 3.1 - Use the properties of the mean and median to...Ch. 3.1 - Use the properties of the mean and median to...Ch. 3.1 - Find the mean, median, and mode of the data in the...Ch. 3.1 - Find the mean, median, and mode of the data in the...Ch. 3.1 - Facebook friends: In a study of Facebook users...Ch. 3.1 - Mean and median height: The National Center for...Ch. 3.1 - Life expectancy: According to the National Vital...Ch. 3.1 - Prob. 34ECh. 3.1 - Hamburgers: An ABC News story reported the number...Ch. 3.1 - Great swimmer: In the 2016 Olympic Games, Michael...Ch. 3.1 - Mobile apps: The following table presents the...Ch. 3.1 - Prob. 38ECh. 3.1 - Whats your favorite TV show? The following tables...Ch. 3.1 - Prob. 40ECh. 3.1 - Gas prices: The following table presents the...Ch. 3.1 - Prob. 42ECh. 3.1 - Heavy football players: Following are the weights,...Ch. 3.1 - Prob. 44ECh. 3.1 - Flu season: The following tables present the...Ch. 3.1 - News flash: The following table presents the...Ch. 3.1 - Commercial break: Following are the amounts spent...Ch. 3.1 - Prob. 48ECh. 3.1 - Dont drink and drive: The Insurance Institute for...Ch. 3.1 - Prob. 50ECh. 3.1 - Be my Valentine: The following frequency...Ch. 3.1 - Get your degree: The following frequency...Ch. 3.1 - Prob. 53ECh. 3.1 - Take in a show: The following table presents the...Ch. 3.1 - Prob. 55ECh. 3.1 - Sources of news: A sample of 32 U.S. adults was...Ch. 3.1 - Find the mean: The National Center for Health...Ch. 3.1 - Find the median: According to a recent Current...Ch. 3.1 - Find the median: In a recent year, approximately...Ch. 3.1 - Find the median: The National Health and Nutrition...Ch. 3.1 - Heights: There are 2500 women and 2000 men...Ch. 3.1 - Prob. 62ECh. 3.1 - Heights: There are 35 students in a class. Fifteen...Ch. 3.1 - Prob. 64ECh. 3.1 - Prob. 65ECh. 3.1 - Prob. 66ECh. 3.1 - Whats the score? Jermaine has entered a bowling...Ch. 3.1 - Whats your grade? Addison has been told that her...Ch. 3.1 - Weighted mean: Rachel worked at three part-time...Ch. 3.1 - Weighted mean: In Jacobs statistics class, the...Ch. 3.1 - Mean or median? The Smith family in Example 3.5...Ch. 3.1 - Prob. 72ECh. 3.1 - Prob. 73ECh. 3.1 - Prob. 74ECh. 3.1 - Prob. 75ECh. 3.1 - Prob. 76ECh. 3.1 - Prob. 77ECh. 3.1 - Prob. 78ECh. 3.1 - Prob. 79ECh. 3.1 - Prob. 80ECh. 3.1 - Prob. 81ECh. 3.1 - Prob. 82ECh. 3.2 - In Exercises 11—14, fill in each blank with the...Ch. 3.2 - In Exercises 11—14, fill in each blank with the...Ch. 3.2 - In Exercises 11—14, fill in each blank with the...Ch. 3.2 - In Exercises 11—14, fill in each blank with the...Ch. 3.2 - In Exercises 15—18, determine whether the...Ch. 3.2 - In Exercises 15—18, determine whether the...Ch. 3.2 - In Exercises 15—18, determine whether the...Ch. 3.2 - In Exercises 15—18, determine whether the...Ch. 3.2 - Find the sample variance and standard deviation...Ch. 3.2 - Find the sample variance and standard deviation...Ch. 3.2 - Find the sample variance and standard deviation...Ch. 3.2 - Find the population variance and standard...Ch. 3.2 - Find the population variance and standard...Ch. 3.2 - Find the population variance and standard...Ch. 3.2 - Approximate the sample variance and standard...Ch. 3.2 - Approximate the sample variance and standard...Ch. 3.2 - Approximate the population variance and standard...Ch. 3.2 - Approximate the population variance and standard...Ch. 3.2 - Distances of the eight planets from the sun, in...Ch. 3.2 - A survey was taken in which people were asked how...Ch. 3.2 - The following TI-84 Plus display presents some...Ch. 3.2 - The following TI-84 Plus display presents some...Ch. 3.2 - The following TI-84 Plus display presents some...Ch. 3.2 - The following TI-84 Plus display presents some...Ch. 3.2 - Amazon: The following table presents the retail...Ch. 3.2 - Sports car or convertible? The following table...Ch. 3.2 - Heavy football players: Following are the weights,...Ch. 3.2 - Beer: The following table presents the number of...Ch. 3.2 - Whats your favorite TV show? The following tables...Ch. 3.2 - House prices: The following table presents prices,...Ch. 3.2 - Stock prices: Following are the closing prices of...Ch. 3.2 - Prob. 42ECh. 3.2 - Time to review: The following table presents the...Ch. 3.2 - Age distribution: The ages of residents of Banks...Ch. 3.2 - Lunch break: In a recent survey of 655 working...Ch. 3.2 - Pay your bills: In a large sample of customer...Ch. 3.2 - Newborn babies: A study conducted by the Center...Ch. 3.2 - Internet providers: In a survey of 600 homeowners...Ch. 3.2 - Lunch break: For the data in Exercise 45, estimate...Ch. 3.2 - Pay your bills: For the data in Exercise 46,...Ch. 3.2 - Newborn babies: For the data in Exercise 47,...Ch. 3.2 - Internet providers: For the data in Exercise 48,...Ch. 3.2 - Prob. 53ECh. 3.2 - Empirical Rule OK? The following histogram...Ch. 3.2 - Empirical Rule OK? The following histogram...Ch. 3.2 - Empirical Rule OK? The following histogram...Ch. 3.2 - Whats the temperature? The temperature in a...Ch. 3.2 - Find the standard deviation: The National Center...Ch. 3.2 - Find the standard deviation: The National Center...Ch. 3.2 - Price of electricity: The Energy Information...Ch. 3.2 - Possible or impossible? A data set has a mean of...Ch. 3.2 - Possible or impossible? A data set has a mean of...Ch. 3.2 - Prob. 63ECh. 3.2 - Prob. 64ECh. 3.2 - Height and weight: A Naona1 Center for Health...Ch. 3.2 - Test scores: Scores on a statistics exam had a...Ch. 3.2 - Mean absolute deviation: A measure of spread that...Ch. 3.2 - Prob. 68ECh. 3.3 - In Exercises 9—12, fill in each blank with the...Ch. 3.3 - In Exercises 9—12, fill in each blank with the...Ch. 3.3 - In Exercises 9—12, fill in each blank with the...Ch. 3.3 - In Exercises 9—12, fill in each blank with the...Ch. 3.3 - In Exercises 13—16, determine whether the...Ch. 3.3 - In Exercises 13—16, determine whether the...Ch. 3.3 - In Exercises 13—16, determine whether the...Ch. 3.3 - In Exercises 13—16, determine whether the...Ch. 3.3 - A popu1aon has mean =7 and standard deviation =2....Ch. 3.3 - A population has mean =25 and standard deviation...Ch. 3.3 - In Exercises 19 and 20, identify the outlier. Then...Ch. 3.3 - Prob. 20ECh. 3.3 - For the data set 37 82 20 25 31 10 41 44 4 36 68...Ch. 3.3 - For the data set Find the first and third...Ch. 3.3 - For the data set Find the 58th percentile. Find...Ch. 3.3 - For the data set Find the 80th percentile. Find...Ch. 3.3 - The following TI-84 Plus display presents the...Ch. 3.3 - Prob. 26ECh. 3.3 - Standardized tests: In a recent year, the mean...Ch. 3.3 - A fish story: The mean length of one-year-old...Ch. 3.3 - Blood pressure in men: The three quartiles for...Ch. 3.3 - Blood pressure in women: The article referred to...Ch. 3.3 - Hazardous waste: Following is a list of the number...Ch. 3.3 - Cholesterol levels: The National Health and...Ch. 3.3 - Commuting to work: Jamie drives to work every...Ch. 3.3 - Windy city by the bay: Following are wind speeds...Ch. 3.3 - Caffeine: Following are the number of grams of...Ch. 3.3 - Prob. 36ECh. 3.3 - Place your bets: In a recent year, 28 states in...Ch. 3.3 - Prob. 38ECh. 3.3 - Prob. 39ECh. 3.3 - Prob. 40ECh. 3.3 - Bragging rights: After learning his score on a...Ch. 3.3 - Who scored the highest? On a final exam in a large...Ch. 3.3 - Baseball salaries: In 2016, the Chicago Cubs...Ch. 3.3 - Prob. 44ECh. 3.3 - Prob. 45ECh. 3.3 - Prob. 46ECh. 3.3 - Prob. 47ECh. 3.3 - Boxplot possible? Following is the five-number...Ch. 3.3 - Unusual boxplot: Ten residents of a town were...Ch. 3.3 - Prob. 50ECh. 3.3 - Highly skewed data: Make up a data set in which...Ch. 3.3 - Highly skewed data: Make up a data set in which...Ch. 3.3 - Prob. 53ECh. 3.3 - Prob. 54ECh. 3.3 - z-scores and skewed data: Table 3.9 presents the...Ch. 3 - Of the mean, median and mode, which must be a...Ch. 3 - The prices (in dollars) for a sample of personal...Ch. 3 - Prob. 3CQCh. 3 - Prob. 4CQCh. 3 - Prob. 5CQCh. 3 - Prob. 6CQCh. 3 - Each of the following histograms represents a data...Ch. 3 - In Exercises 8—11, suppose that the mean...Ch. 3 - Prob. 9CQCh. 3 - In Exercises 8—11, suppose that the mean...Ch. 3 - Prob. 11CQCh. 3 - Prob. 12CQCh. 3 - Prob. 13CQCh. 3 - Prob. 14CQCh. 3 - Prob. 15CQCh. 3 - Prob. 1RECh. 3 - Prob. 2RECh. 3 - Prob. 3RECh. 3 - Prob. 4RECh. 3 - Prob. 5RECh. 3 - Prob. 6RECh. 3 - Measure that ball: Each of 16 students measured...Ch. 3 - Prob. 8RECh. 3 - Rivets: A machine makes rivets that are used in...Ch. 3 - Prob. 10RECh. 3 - Prob. 11RECh. 3 - Advertising costs: The amounts spent (in billions)...Ch. 3 - Prob. 13RECh. 3 - Prob. 14RECh. 3 - Prob. 15RECh. 3 - The U.S. Department of Labor annually publishes an...Ch. 3 - Explain why the Empirical Rule is more useful than...Ch. 3 - Prob. 3WAICh. 3 - Prob. 4WAICh. 3 - Percentiles are values that divide a data set into...Ch. 3 - Prob. 1CSCh. 3 - Prob. 2CSCh. 3 - Prob. 3CSCh. 3 - Prob. 4CSCh. 3 - Prob. 5CSCh. 3 - Prob. 6CSCh. 3 - Prob. 7CSCh. 3 - Prob. 8CSCh. 3 - Electronic devices contain electric circuits...
Knowledge Booster


Learn more about
Need a deep-dive on the concept behind this application? Look no further. Learn more about this topic, statistics and related others by exploring similar questions and additional content below.Similar questions
- A horse trainer teaches horses to jump by using two methods of instruction. Horses being taught by method A have a lead horse that accompanies each jump. Horses being taught by method B have no lead horse. The table shows the number of training sessions required before each horse performed the jumps properly. Method A 25 23 39 29 37 20 Method B 41 21 46 42 24 44 Method A 45 35 27 31 34 49 Method B 26 43 47 32 40 Use a rank-sum test with a5% level of significance to test the claim that there is no difference between the training sessions distributions. If the value of the sample test statistic R, the rank-sum, is 150, calculate the P-value. Round your answer to four decimal places.arrow_forwardA data processing company has a training program for new salespeople. After completing the training program, each trainee is ranked by his or her instructor. After a year of sales, the same class of trainees is again ranked by a company supervisor according to net value of the contracts they have acquired for the company. The results for a random sample of 11 salespeople trained in the last year follow, where x is rank in training class and y is rank in sales after 1 year. Lower ranks mean higher standing in class and higher net sales. Person 1 2 3 4 5 6 x rank 8 11 2 4 5 3 y rank 7 10 1 3 2 4 Person 7 8 9 10 11 x rank 7 9 10 1 6 y rank 8 11 9 6 5 Using a 1% level of significance, test the claim that the relation between x and y is monotone (either increasing or decreasing). Verify that the Spearman rank correlation coefficient . This implies that the P-value lies between 0.002 and 0.01. State…arrow_forwardSand and clay studies were conducted at a site in California. Twelve consecutive depths, each about 15 cm deep, were studied and the following percentages of sand in the soil were recorded. 34.4 27.1 30.8 28.0 32.2 27.6 32.8 25.2 31.4 33.5 24.7 28.4 Converting this sequence of numbers to a sequence of symbols A and B, where A indicates a value above the median and B denotes a value below the median gives ABABABABAABB. Test the sequence for randomness about the median with a 5% level of significance. Verify that the number of runs is 10. What is the upper critical value c2? arrow_forward
- Sand and clay studies were conducted at a site in California. Twelve consecutive depths, each about 15 cm deep, were studied and the following percentages of sand in the soil were recorded. 34.4 27.1 30.8 28.0 32.2 27.6 32.8 25.2 31.4 33.5 24.7 28.4 Converting this sequence of numbers to a sequence of symbols A and B, where A indicates a value above the median and B denotes a value below the median gives ABABABABAABB. Test the sequence for randomness about the median with a 5% level of significance. Verify that the number of runs is 10. What is the upper critical value c2?arrow_forward29% of all college students major in STEM (Science, Technology, Engineering, and Math). If 46 college students are randomly selected, find the probability thata. Exactly 11 of them major in STEM. b. At most 12 of them major in STEM. c. At least 11 of them major in STEM. d. Between 11 and 15 (including 11 and 15) of them major in STEM.arrow_forwardSand and clay studies were conducted at a site in California. Twelve consecutive depths, each about 15 cm deep, were studied and the following percentages of sand in the soil were recorded. 27.3 34.6 30.6 27.8 33.4 31.5 27.3 31.2 32.0 24.7 24.4 28.2 Test this sequence for randomness about the median. Converting this sequence of numbers to a sequence of symbols A and B, where A indicates a value above the median and B denotes a value below the median gives BAABAABAABBB. Verify that the number of runs is 7, the lower critical number is 3, and the upper critical number is 11. Use a 5% level of significance. State the conclusion of the test and interpret your results.arrow_forward
- 29% of all college students major in STEM (Science, Technology, Engineering, and Math). If 46 college students are randomly selected, find the probability thata. Exactly 11 of them major in STEM. b. At most 12 of them major in STEM. c. At least 11 of them major in STEM. d. Between 11 and 15 (including 11 and 15) of them major in STEM.arrow_forwardPlease solving problem2 Problem1 We consider a two-period binomial model with the following properties: each period lastsone (1) year and the current stock price is S0 = 4. On each period, the stock price doubleswhen it moves up and is reduced by half when it moves down. The annual interest rateon the money market is 25%. (This model is the same as in Prob. 1 of HW#2).We consider four options on this market: A European call option with maturity T = 2 years and strike price K = 5; A European put option with maturity T = 2 years and strike price K = 5; An American call option with maturity T = 2 years and strike price K = 5; An American put option with maturity T = 2 years and strike price K = 5.(a) Find the price at time 0 of both European options.(b) Find the price at time 0 of both American options. Compare your results with (a)and comment.(c) For each of the American options, describe the optimal exercising strategy.arrow_forwardProblem 1.We consider a two-period binomial model with the following properties: each period lastsone (1) year and the current stock price is S0 = 4. On each period, the stock price doubleswhen it moves up and is reduced by half when it moves down. The annual interest rateon the money market is 25%. We consider four options on this market: A European call option with maturity T = 2 years and strike price K = 5; A European put option with maturity T = 2 years and strike price K = 5; An American call option with maturity T = 2 years and strike price K = 5; An American put option with maturity T = 2 years and strike price K = 5.(a) Find the price at time 0 of both European options.(b) Find the price at time 0 of both American options. Compare your results with (a)and comment.(c) For each of the American options, describe the optimal exercising strategy.(d) We assume that you sell the American put to a market participant A for the pricefound in (b). Explain how you act on the market…arrow_forward
- What is the standard scores associated to the left of z is 0.1446arrow_forwardNote: The purpose of this problem below is to use computational techniques (Excelspreadsheet, Matlab, R, Python, etc.) and code the dynamic programming ideas seen inclass. Please provide the numerical answer to the questions as well as a sample of yourwork (spreadsheet, code file, etc.).We consider an N-period binomial model with the following properties: N = 60, thecurrent stock price is S0 = 1000; on each period, the stock price increases by 0.5% whenit moves up and decreases by 0.3% when it moves down. The annual interest rate on themoney market is 5%. (Notice that this model is a CRR model, which means that thebinomial tree is recombining.)(a) Find the price at time t0 = 0 of a (European) call option with strike price K = 1040and maturity T = 1 year.(b) Find the price at time t0 = 0 of a (European) put option with strike price K = 1040and maturity T = 1 year.(c) We consider now, that you are at time t5 (i.e. after 5 periods, which represents 1month later). Assume that the stock…arrow_forwardshow work in paperarrow_forward
arrow_back_ios
SEE MORE QUESTIONS
arrow_forward_ios
Recommended textbooks for you
 Glencoe Algebra 1, Student Edition, 9780079039897...AlgebraISBN:9780079039897Author:CarterPublisher:McGraw Hill
 Big Ideas Math A Bridge To Success Algebra 1: Stu...AlgebraISBN:9781680331141Author:HOUGHTON MIFFLIN HARCOURTPublisher:Houghton Mifflin Harcourt
 Holt Mcdougal Larson Pre-algebra: Student Edition...AlgebraISBN:9780547587776Author:HOLT MCDOUGALPublisher:HOLT MCDOUGAL
Glencoe Algebra 1, Student Edition, 9780079039897...
Algebra
ISBN:9780079039897
Author:Carter
Publisher:McGraw Hill
Big Ideas Math A Bridge To Success Algebra 1: Stu...
Algebra
ISBN:9781680331141
Author:HOUGHTON MIFFLIN HARCOURT
Publisher:Houghton Mifflin Harcourt
Holt Mcdougal Larson Pre-algebra: Student Edition...
Algebra
ISBN:9780547587776
Author:HOLT MCDOUGAL
Publisher:HOLT MCDOUGAL
The Shape of Data: Distributions: Crash Course Statistics #7; Author: CrashCourse;https://www.youtube.com/watch?v=bPFNxD3Yg6U;License: Standard YouTube License, CC-BY
Shape, Center, and Spread - Module 20.2 (Part 1); Author: Mrmathblog;https://www.youtube.com/watch?v=COaid7O_Gag;License: Standard YouTube License, CC-BY
Shape, Center and Spread; Author: Emily Murdock;https://www.youtube.com/watch?v=_YyW0DSCzpM;License: Standard Youtube License