
PRINCIPLES OF ECONOMICS
14th Edition
ISBN: 2810015433483
Author: OpenStax
Publisher: OpenStax
expand_more
expand_more
format_list_bulleted
Textbook Question
Chapter 33, Problem 31P
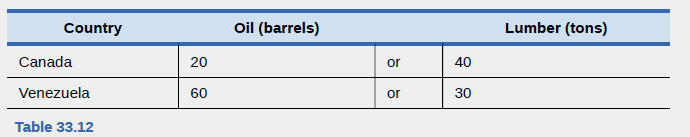
Review the numbers for Canada and Venezuela from Table 33.12 which describes how many barrels of oil and tons of lumber the workers can produce. Use these numbers to answer the rest of this question.
- Draw a production possibilities frontier for each country. Assume there are 100 workers in each country. Canadians and Venezuelans desire both oil and lumber. Canadians want at least 2,000 tons of lumber. Mark a point on their production possibilities where they can get at least 3,000 tons.
- Assume that the Canadians specialize completely because they figured out they have a
comparative advantage in lumber. They are willing to give up 1,000 tons of lumber. How much oil should they ask for in return for this lumber to be as well off as they were with no trade? How much should they ask for if they want to gain from trading with Venezuela? Note:
We can think of this “ask” as the relative price or trade price of lumber.
Expert Solution & Answer

Trending nowThis is a popular solution!

Students have asked these similar questions
Not use ai please
Answer for question 1
Not use ai please
Chapter 33 Solutions
PRINCIPLES OF ECONOMICS
Ch. 33 - True or False: The source of comparative advantage...Ch. 33 - Brazil can produce 100 pounds of beef or 10 autos....Ch. 33 - In France it takes one worker to produce one...Ch. 33 - In Germany it takes three workers to make one...Ch. 33 - How can there be any economic gains for a country...Ch. 33 - Table 33.15 shows how the average costs of...Ch. 33 - If the removal of trade banters is so beneficial...Ch. 33 - What is absolute advantage? What is comparative...Ch. 33 - Under what conditions does comparative advantage...Ch. 33 - What factors does Paul Krugman identity that...
Ch. 33 - Is it possible to have a comparative advantage in...Ch. 33 - How does comparative advantage lead to gains from...Ch. 33 - What is intra-industry trade?Ch. 33 - What are the two main sources of economic gains...Ch. 33 - What is splitting up the value chain?Ch. 33 - Are the gains from international trade more likely...Ch. 33 - Are differences in geography behind the...Ch. 33 - Why does the United States not have an absolute...Ch. 33 - Look at Exercise 33.2. Compute the opportunity...Ch. 33 - You just overheard your friend say the following:...Ch. 33 - Look at Table 33.9. Is there a range of trades for...Ch. 33 - You just got a job in Washington, D.C. You move...Ch. 33 - Does intra-industry trade contradict the theory of...Ch. 33 - Do consumers benefit from intra-industry trade?Ch. 33 - Why might intra-industry trade seem surprising...Ch. 33 - In World Trade Organization meetings, what do you...Ch. 33 - Why might a low-income country put up barriers to...Ch. 33 - Can a nations comparative advantage change over...Ch. 33 - France and Tunisia both have Mediterranean...Ch. 33 - In Japan, one worker can make 5 tons of rubber or...Ch. 33 - Review the numbers for Canada and Venezuela from...Ch. 33 - In Exercise 33.31, is there an ask where...Ch. 33 - From earlier chapters you will recall that...Ch. 33 - Consider two countries: South Korea and Taiwan....Ch. 33 - If trade increases world GDP by 1 per year, what...
Additional Business Textbook Solutions
Find more solutions based on key concepts
Horizontal analysis(Learning Objective 2)15-20 min. What were the dollar and percentage changes in Fesslers Fin...
Financial Accounting, Student Value Edition (5th Edition)
The put option’s leverage ratio is -1.9. Introduction: Expected return is the method of finding the average ant...
Corporate Finance (4th Edition) (Pearson Series in Finance) - Standalone book
E2-13 Identifying increases and decreases in accounts and normal balances
Learning Objective 2
Insert the mis...
Horngren's Accounting (12th Edition)
Communication Activity 9-1
In 150 words or fewer, explain the different methods that can be used to calculate d...
Horngren's Financial & Managerial Accounting, The Financial Chapters (Book & Access Card)
Questions For Review
12-4. How is the concept of the value package useful in marketing to consumers and industr...
Business Essentials (12th Edition) (What's New in Intro to Business)
The weaknesses of payback period method of calculation. Introduction: Every investment requires a time period t...
Gitman: Principl Manageri Finance_15 (15th Edition) (What's New in Finance)
Knowledge Booster

Similar questions
- Not use ai pleasearrow_forwardNot use ai pleasearrow_forwardSuppose there is a new preventative treatment for a common disease. If you take the preventative treatment, it reduces the average amount of time you spend sick by 10%. The optimal combination of Z (home goods) and H (health goods). both may increase both may increase or one may stay the same while the other increases. both may decrease H may increase; Z may not change Z may increase; H may decreasearrow_forward
- This question examines the relationship between the Indian rupee (Rs) and the US dollar ($). We denote the exchange rate in rupees per dollar as ERS/$. Suppose the Bank of India permanently decreases its money supply by 4%. 1. First, consider the effect in the long run. Using the following equation, explain how the change in India's money supply affects the Indian price level, PIN, and the exchange rate, ERS/$: AERS/STIN ERS/$ - ·TUS = (MIN - 9IN) - (Mus - gus). MIN 2. How does the decrease in India's money supply affect the real money supply, in the long PIN run. 3. Based on your previous answer, how does the decrease in the Indian money supply affect the nominal interest rate, UN, in the long run? (hint: M = L(i)Y hold in the long run) 4. Illustrate the graphs to show how a permanent decrease in India's money supply affects India's money and FX markets in the long run. (hint: you may refer to the figures on lecture slides #5, titled "Analysis in the long run.") 5. Illustrate the…arrow_forwardPlease explain the concept/what this fill in graph, thanksarrow_forwardElasticity Problems Cross Price Elasticity (Exy) (QDX-QDo/[(QDN+QDDA)/2] (P-POR/[(PNE+POB)/2]¯¯ 11. QD of good A falls from 100 to 90 as the price of good B rose from $10 to $20. Calculate coefficient: (90-100) [(90+100) 21-10/95-105 - -.158 (20-10)/[(20+10)/2] 10/15 .667 Cite Elasticity: inclastic Typs of good: complement 12. QD of good A rose from 300 to 400 as the price good K increased from $1 to $2. Calculate coefficient Cite Elasticity: Ixps of reed: 13. QD for good I falls from 2000 to 1500 units as price of good Krose from $10 to $15. Calculate coefficient: Cite Elasticity: Type of good: 14. QD for good X rose from 100 to 101 units as price of good Y increases from, $8 to $15. Calculate coefficient: Cite Elasticity: Type of paed: Page 124 (368) Value of Coefficient Description Positive (0) Negative (L*0) Type of Good(s) Substitute Quantity Demanded of W changes in same direction a change in price if Z Quantity Demanded of W changes in opposite direction as change in price if Z…arrow_forward
arrow_back_ios
SEE MORE QUESTIONS
arrow_forward_ios
Recommended textbooks for you
 Exploring EconomicsEconomicsISBN:9781544336329Author:Robert L. SextonPublisher:SAGE Publications, Inc


 Economics (MindTap Course List)EconomicsISBN:9781337617383Author:Roger A. ArnoldPublisher:Cengage Learning
Exploring Economics
Economics
ISBN:9781544336329
Author:Robert L. Sexton
Publisher:SAGE Publications, Inc
Economics (MindTap Course List)
Economics
ISBN:9781337617383
Author:Roger A. Arnold
Publisher:Cengage Learning