
Essentials of Statistics Plus MyLab Statistics with Pearson eText -- Access Card Package (6th Edition) (What's New in Statistics)
6th Edition
ISBN: 9780134858517
Author: Mario F. Triola
Publisher: PEARSON
expand_more
expand_more
format_list_bulleted
Concept explainers
Videos
Textbook Question
Chapter 3.3, Problem 22BSC
Percentiles. In Exercises 17-20, use the following cell phone airport data speeds (Mbps) from Sprint. Find the percentile corresponding to the given data speed.
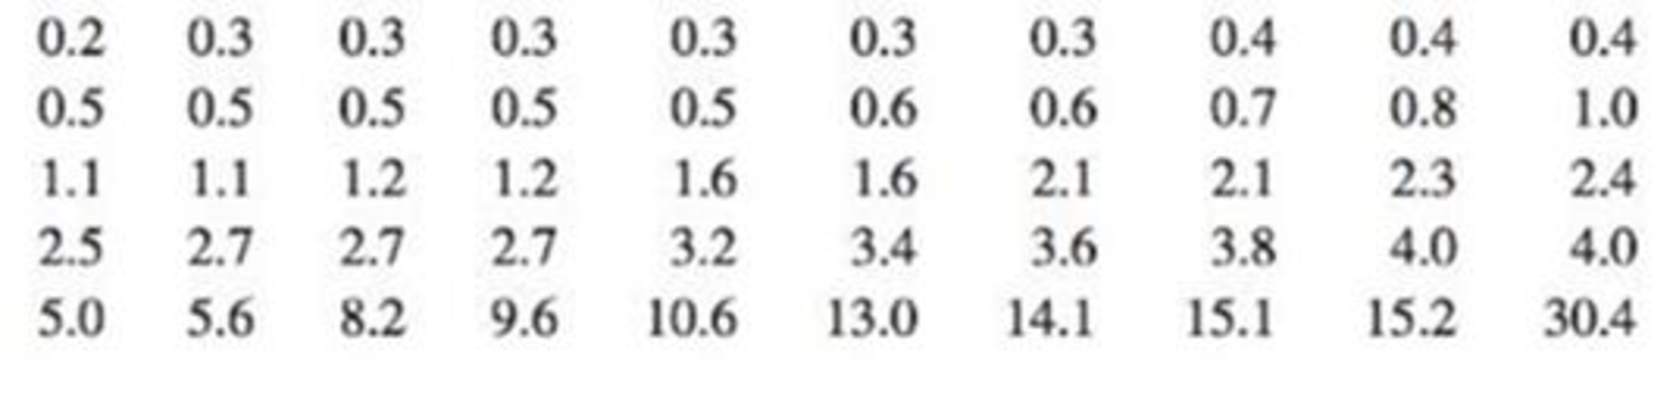
In Exercises 21-28, use the same list of Sprint airport data speeds (Mbps) given for Exercises 17-20. Find the indicated percentile or
22. Q1
Expert Solution & Answer
Want to see the full answer?
Check out a sample textbook solution
Students have asked these similar questions
Question 2
The data below provides the battery life of thirty eight (38) motorcycle batteries.
100 83 83 105 110 81 114
99 101 105 78 115 74 96
106
89
94 81 106 91 93 86
79 103 94 108 113 100
117 120
77 93
93 85 76
89 78 88
680
a. Test the hypothesis that mean battery life is greater than 90. Use the 1% level of
significance.
b. Determine if the mean battery life is different from 80. Use the 10% level of
significance. Show all steps for the hypothesis test
c. Would your conlcusion in part (b) change at the 5% level of significance? |
d. Confirm test results in part (b) using JASP. Note: All JASP input files and output
tables should be provided
Suppose that 80% of athletes at a certain college graduate. You randomly select eight athletes. What’s the chance that at most 7 of them graduate?
Suppose that you flip a fair coin four times. What’s the chance of getting at least one head?
Chapter 3 Solutions
Essentials of Statistics Plus MyLab Statistics with Pearson eText -- Access Card Package (6th Edition) (What's New in Statistics)
Ch. 3.1 - Average The defunct website IncomeTaxList.com...Ch. 3.1 - Whats Wrong? USA Today published a list consisting...Ch. 3.1 - Measures of Center In what sense are the mean,...Ch. 3.1 - Resistant Measures Here are four of the Verizon...Ch. 3.1 - Critical Thinking. For Exercises 5-20, watch out...Ch. 3.1 - Critical Thinking. For Exercises 5-20, watch out...Ch. 3.1 - Critical Thinking. For Exercises 5-20, watch out...Ch. 3.1 - Critical Thinking. For Exercises 5-20, watch out...Ch. 3.1 - Critical Thinking. For Exercises 5-20, watch out...Ch. 3.1 - Critical Thinking. For Exercises 5-20, watch out...
Ch. 3.1 - Critical Thinking. For Exercises 5-20, watch out...Ch. 3.1 - Critical Thinking. For Exercises 5-20, watch out...Ch. 3.1 - Critical Thinking. For Exercises 5-20, watch out...Ch. 3.1 - Critical Thinking. For Exercises 5-20, watch out...Ch. 3.1 - Critical Thinking. For Exercises 5-20, watch out...Ch. 3.1 - Critical Thinking. For Exercises 5-20, watch out...Ch. 3.1 - Critical Thinking. For Exercises 5-20, watch out...Ch. 3.1 - Critical Thinking. For Exercises 5-20, watch out...Ch. 3.1 - Critical Thinking. For Exercises 5-20, watch out...Ch. 3.1 - Critical Thinking. For Exercises 5-20, watch out...Ch. 3.1 - In Exercises 21-24, find the mean and median for...Ch. 3.1 - In Exercises 21-24, find the mean and median for...Ch. 3.1 - In Exercises 21-24, find the mean and median for...Ch. 3.1 - In Exercises 21-24, find the mean and median for...Ch. 3.1 - In Exercises 29-32, find the mean of the data...Ch. 3.1 - In Exercises 29-32, find the mean of the data...Ch. 3.1 - In Exercises 29-32, find the mean of the data...Ch. 3.1 - In Exercises 29-32, find the mean of the data...Ch. 3.1 - Weighted Mean A student of the author earned...Ch. 3.1 - Weighted Mean A student of the author earned...Ch. 3.1 - Degrees of Freedom Five pulse rates randomly...Ch. 3.1 - Censored Data Data Set 15 Presidents in Appendix B...Ch. 3.1 - Trimmed Mean Because the mean is very sensitive to...Ch. 3.1 - Harmonic Mean The harmonic mean is often used as a...Ch. 3.1 - Geometric Mean The geometric mean is often used in...Ch. 3.1 - Quadratic Mean The quadratic mean (or root mean...Ch. 3.2 - Range Rule of Thumb for Estimating s The 20 brain...Ch. 3.2 - Range Rule of Thumb for Interpreting s The 20...Ch. 3.2 - Variance The 20 subjects used in Data Set 8 IQ and...Ch. 3.2 - Symbols Identify the symbols used for each of the...Ch. 3.2 - In Exercises 5-20, find the range, variance, and...Ch. 3.2 - In Exercises 5-20, find the range, variance, and...Ch. 3.2 - In Exercises 5-20, find the range, variance, and...Ch. 3.2 - In Exercises 5-20, find the range, variance, and...Ch. 3.2 - In Exercises 5-20, find the range, variance, and...Ch. 3.2 - In Exercises 5-20, find the range, variance, and...Ch. 3.2 - In Exercises 5-20, find the range, variance, and...Ch. 3.2 - In Exercises 5-20, find the range, variance, and...Ch. 3.2 - In Exercises 5-20, find the range, variance, and...Ch. 3.2 - In Exercises 5-20, find the range, variance, and...Ch. 3.2 - In Exercises 5-20, find the range, variance, and...Ch. 3.2 - In Exercises 5-20, find the range, variance, and...Ch. 3.2 - In Exercises 5-20, find the range, variance, and...Ch. 3.2 - In Exercises 5-20, find the range, variance, and...Ch. 3.2 - In Exercises 5-20, find the range, variance, and...Ch. 3.2 - In Exercises 5-20, find the range, variance, and...Ch. 3.2 - In Exercises 21-24, find the coefficient of...Ch. 3.2 - In Exercises 21-24, find the coefficient of...Ch. 3.2 - In Exercises 21-24, find the coefficient of...Ch. 3.2 - In Exercises 21-24, find the coefficient of...Ch. 3.2 - Identifying Significant Values with the Range Rule...Ch. 3.2 - Prob. 34BSCCh. 3.2 - Foot Lengths Based on Data Set 2 Foot and Height...Ch. 3.2 - Identifying Significant Values with the Range Rule...Ch. 3.2 - Finding Standard Deviation from a Frequency...Ch. 3.2 - Finding Standard Deviation from a Frequency...Ch. 3.2 - Finding Standard Deviation from a Frequency...Ch. 3.2 - Finding Standard Deviation from a Frequency...Ch. 3.2 - The Empirical Rule Based on Data Set 1 Body Data...Ch. 3.2 - The Empirical Rule Based on Data Set 3 Body...Ch. 3.2 - Chebyshevs Theorem Based on Data Set 1 Body Data...Ch. 3.2 - Chebyshevs Theorem Based on Data Set 3 Body...Ch. 3.2 - Why Divide by n 1? Let a population consist of...Ch. 3.2 - Mean Absolute Deviation Use the same population of...Ch. 3.3 - z Scores LeBron James, one of the most successful...Ch. 3.3 - Heights The boxplot shown below results from the...Ch. 3.3 - Boxplot Comparison Refer to the boxplots shown...Ch. 3.3 - z Scores If your score on your next statistics...Ch. 3.3 - z Scores. In Exercises 5-8, express all z scores...Ch. 3.3 - z Scores. In Exercises 5-8, express all z scores...Ch. 3.3 - z Scores. In Exercises 5-8, express all z scores...Ch. 3.3 - z Scores. In Exercises 5-8, express all z scores...Ch. 3.3 - Significant Values. In Exercises 9-12, consider a...Ch. 3.3 - Significant Values. In Exercises 9-12, consider a...Ch. 3.3 - Significant Values. In Exercises 9-12, consider a...Ch. 3.3 - Significant Values. In Exercises 9-12, consider a...Ch. 3.3 - Comparing Values. In Exercises 13-16, use z scores...Ch. 3.3 - Comparing Values. In Exercises 13-16, use z scores...Ch. 3.3 - Comparing Values. In Exercises 13-16, use z scores...Ch. 3.3 - Comparing Values. In Exercises 13-16, use z scores...Ch. 3.3 - Percentiles. In Exercises 17-20, use the following...Ch. 3.3 - Percentiles. In Exercises 17-20, use the following...Ch. 3.3 - Percentiles. In Exercises 17-20, use the following...Ch. 3.3 - Percentiles. In Exercises 17-20, use the following...Ch. 3.3 - Percentiles. In Exercises 17-20, use the following...Ch. 3.3 - Percentiles. In Exercises 17-20, use the following...Ch. 3.3 - Percentiles. In Exercises 17-20, use the following...Ch. 3.3 - Percentiles. In Exercises 17-20, use the following...Ch. 3.3 - Percentiles. In Exercises 17-20, use the following...Ch. 3.3 - Percentiles. In Exercises 17-20, use the following...Ch. 3.3 - Percentiles. In Exercises 17-20, use the following...Ch. 3.3 - Percentiles. In Exercises 17-20, use the following...Ch. 3.3 - Boxplots. In Exercises 29-32, use the given data...Ch. 3.3 - Boxplots. In Exercises 29-32, use the given data...Ch. 3.3 - Boxplots. In Exercises 29-32, use the given data...Ch. 3.3 - Boxplots. In Exercises 29-32, use the given data...Ch. 3 - Sleep Mean As part of the National Health and...Ch. 3 - Sleep Median What is the median of the sample...Ch. 3 - Sleep Mode What is the mode of the sample values...Ch. 3 - Sleep Variance The standard deviation of the...Ch. 3 - Prob. 5CQQCh. 3 - Sleep z Score A larger sample of 50 sleep times...Ch. 3 - Sleep Q3 For a sample of 80 sleep times,...Ch. 3 - Sleep 5-Number Summary For a sample of 100 sleep...Ch. 3 - Estimating s A large sample of sleep times...Ch. 3 - Sleep Notation Consider a sample of sleep times...Ch. 3 - Old Faithful Geyser Listed below are prediction...Ch. 3 - z Score Using the sample data from Exercise 1,...Ch. 3 - Boxplot Using the same prediction errors listed in...Ch. 3 - ER Codes In an analysis of activities that...Ch. 3 - Comparing Birth Weights The birth weights of a...Ch. 3 - Effects of an Outlier Listed below are platelet...Ch. 3 - Interpreting a Boxplot Shown below is a boxplot of...Ch. 3 - Estimating Standard Deviation Listed below is a...Ch. 3 - Prob. 1CRECh. 3 - Prob. 2CRECh. 3 - Stemplot Use the amounts of arsenic from Exercise...Ch. 3 - Prob. 4CRECh. 3 - Histogram The accompanying histogram depicts...Ch. 3 - Normal Distribution Examine the distribution shown...
Additional Math Textbook Solutions
Find more solutions based on key concepts
(a) Make a stem-and-leaf plot for these 24 observations on the number of customers who used a down-town CitiBan...
APPLIED STAT.IN BUS.+ECONOMICS
Let F be a continuous distribution function. If U is uniformly distributed on (0,1), find the distribution func...
A First Course in Probability (10th Edition)
23. A plant nursery sells two sizes of oak trees to landscapers. Large trees cost the nursery $120 from the gro...
College Algebra (Collegiate Math)
Reading, Writing, and Rounding Whole Numbers Write in words. 357
Mathematics for the Trades: A Guided Approach (11th Edition) (What's New in Trade Math)
153. A rain gutter is made from sheets of aluminum that are 20 inches wide. As shown in the figure, the edges ...
College Algebra (7th Edition)
1. How is a sample related to a population?
Elementary Statistics: Picturing the World (7th Edition)
Knowledge Booster


Learn more about
Need a deep-dive on the concept behind this application? Look no further. Learn more about this topic, statistics and related others by exploring similar questions and additional content below.Similar questions
- Suppose that the chance that an elementary student eats hot lunch is 30 percent. What’s the chance that, among 20 randomly selected students, between 6 and 8 students eat hot lunch (inclusive)?arrow_forwardBob’s commuting times to work are varied. He makes it to work on time 80 percent of the time. On 12 randomly selected trips to work, what’s the chance that Bob makes it on time at least 10 times?arrow_forwardYour chance of winning a small prize in a scratch-off ticket is 10 percent. You buy five tickets. What’s the chance you will win at least one prize?arrow_forward
- Suppose that 60 percent of families own a pet. You randomly sample four families. What is the chance that two or three of them own a pet?arrow_forwardIf 40 percent of university students purchase their textbooks online, in a random sample of five students, what’s the chance that exactly one of them purchased their textbooks online?arrow_forwardA stoplight is green 40 percent of the time. If you stop at this light eight random times, what is the chance that it’s green exactly five times?arrow_forward
- If 10 percent of the parts made by a certain company are defective and have to be remade, what is the chance that a random sample of four parts has one that is defective?arrow_forwardQuestion 4 Fourteen individuals were given a complex puzzle to complete. The times in seconds was recorded for their first and second attempts and the results provided below: 1 2 3 first attempt 172 255 second attempt 70 4 5 114 248 218 194 270 267 66 6 7 230 219 341 174 8 10 9 210 261 347 218 200 281 199 308 268 243 236 300 11 12 13 14 140 302 a. Calculate a 95% confidence interval for the mean time taken by each individual to complete the (i) first attempt and (ii) second attempt. [la] b. Test the hypothesis that the difference between the two mean times for both is 100 seconds. Use the 5% level of significance. c. Subsequently, it was learnt that the times for the second attempt were incorrecly recorded and that each of the values is 50 seconds too large. What, if any, difference does this make to the results of the test done in part (b)? Show all steps for the hypothesis testarrow_forwardQuestion 3 3200 students were asked about the importance of study groups in successfully completing their courses. They were asked to provide their current majors as well as their opinion. The results are given below: Major Opinion Psychology Sociology Economics Statistics Accounting Total Agree 144 183 201 271 251 1050 Disagree 230 233 254 227 218 1162 Impartial 201 181 196 234 176 988 Total 575 597 651 732 645 3200 a. State both the null and alternative hypotheses. b. Provide the decision rule for making this decision. Use an alpha level of 5%. c. Show all of the work necessary to calculate the appropriate statistic. | d. What conclusion are you allowed to draw? c. Would your conclusion change at the 10% level of significance? f. Confirm test results in part (c) using JASP. Note: All JASP input files and output tables should be providedarrow_forward
- Question 1 A tech company has acknowledged the importance of having records of all meetings conducted. The meetings are very fast paced and requires equipment that is able to capture the information in the shortest possible time. There are two options, using a typewriter or a word processor. Fifteen administrative assistants are selected and the amount of typing time in hours was recorded. The results are given below: 1 2 3 4 5 6 7 8 9 10 11 12 13 14 15 typewriter 8.0 6.5 5.0 6.7 7.8 8.5 7.2 5.7 9.2 5.7 6.5 word processor 7.2 5.7 8.3 7.5 9.2 7.2 6.5 7.0 6.9 34 7.0 6.9 8.8 6.7 8.8 9.4 8.6 5.5 7.2 8.4 a. Test the hypothesis that the mean typing time in hours for typewriters is less than 7.0. Use the 1% level of significance. b. Construct a 90% confidence interval for the difference in mean typing time in hours, where a difference is equal to the typing time in hours of word processors minus typing time in hours of typewriter. c. Using the 5% significance level, determine whether there is…arrow_forwardIllustrate 2/7×4/5 using a rectangular region. Explain your work. arrow_forwardWrite three other different proportions equivalent to the following using the same values as in the given proportion 3 foot over 1 yard equals X feet over 5 yardsarrow_forward
arrow_back_ios
SEE MORE QUESTIONS
arrow_forward_ios
Recommended textbooks for you
 Glencoe Algebra 1, Student Edition, 9780079039897...AlgebraISBN:9780079039897Author:CarterPublisher:McGraw Hill
 Holt Mcdougal Larson Pre-algebra: Student Edition...AlgebraISBN:9780547587776Author:HOLT MCDOUGALPublisher:HOLT MCDOUGAL
 Big Ideas Math A Bridge To Success Algebra 1: Stu...AlgebraISBN:9781680331141Author:HOUGHTON MIFFLIN HARCOURTPublisher:Houghton Mifflin Harcourt
Glencoe Algebra 1, Student Edition, 9780079039897...
Algebra
ISBN:9780079039897
Author:Carter
Publisher:McGraw Hill
Holt Mcdougal Larson Pre-algebra: Student Edition...
Algebra
ISBN:9780547587776
Author:HOLT MCDOUGAL
Publisher:HOLT MCDOUGAL
Big Ideas Math A Bridge To Success Algebra 1: Stu...
Algebra
ISBN:9781680331141
Author:HOUGHTON MIFFLIN HARCOURT
Publisher:Houghton Mifflin Harcourt
Statistics 4.1 Point Estimators; Author: Dr. Jack L. Jackson II;https://www.youtube.com/watch?v=2MrI0J8XCEE;License: Standard YouTube License, CC-BY
Statistics 101: Point Estimators; Author: Brandon Foltz;https://www.youtube.com/watch?v=4v41z3HwLaM;License: Standard YouTube License, CC-BY
Central limit theorem; Author: 365 Data Science;https://www.youtube.com/watch?v=b5xQmk9veZ4;License: Standard YouTube License, CC-BY
Point Estimate Definition & Example; Author: Prof. Essa;https://www.youtube.com/watch?v=OTVwtvQmSn0;License: Standard Youtube License
Point Estimation; Author: Vamsidhar Ambatipudi;https://www.youtube.com/watch?v=flqhlM2bZWc;License: Standard Youtube License