Elementary Statistics Using the TI-83/84 Plus Calculator Books a la carte Plus NEW MyLab Statistics with Pearson eText - Access Card Package (4th Edition)
4th Edition
ISBN: 9780133873795
Author: Mario F. Triola
Publisher: PEARSON
expand_more
expand_more
format_list_bulleted
Concept explainers
Videos
Textbook Question
Chapter 3.3, Problem 22BSC
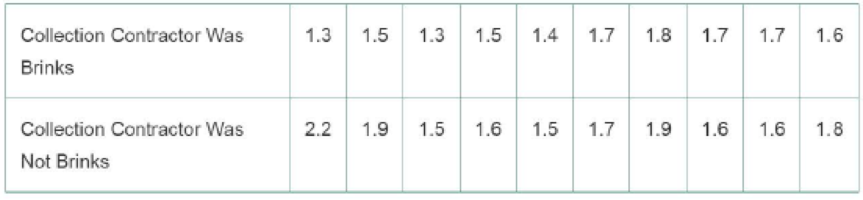
In Exercises 21–24, find the coefficient of variation for each of the two samples; then compare the variation. (The same data were used in Section 3-1.)
22. Parking Meter Theft Listed below are amounts (in millions of dollars) collected from parking meters by Brinks and others in New York City during similar time periods. A larger data set was used to convict five Brinks employees of grand larceny. The data were provided by the attorney for New York City, and they are listed on the DASL Website. Do the two samples appear to have different amounts of variation?
Expert Solution & Answer
Want to see the full answer?
Check out a sample textbook solution
Students have asked these similar questions
show all steps
Most people know that the probability of getting a head when you flip a fair coin is . You want to use the relative frequency of the event to show that the probability is . How many times should you simulate flipping the coin in the experiment? Would it be better to use 300 trials or 3000 trials? Explain.
The qualified applicant pool for eight management trainee positions consists of ten women and six men. How many different groups of applicants can be selected for the positions
Chapter 3 Solutions
Elementary Statistics Using the TI-83/84 Plus Calculator Books a la carte Plus NEW MyLab Statistics with Pearson eText - Access Card Package (4th Edition)
Ch. 3.2 - Prob. 1BSCCh. 3.2 - 2. Average The web site IncomeTaxList.com lists...Ch. 3.2 - Prob. 3BSCCh. 3.2 - Measures of Center In what sense are the mean,...Ch. 3.2 - Prob. 5BSCCh. 3.2 - In Exercises 5-20, find the (a) mean, (b) median,...Ch. 3.2 - In Exercises 5-20, find the (a) mean, (b) median,...Ch. 3.2 - In Exercises 5-20, find the (a) mean, (b) median,...Ch. 3.2 - In Exercises 5-20, find the (a) mean, (b) median,...Ch. 3.2 - In Exercises 5-20, find the (a) mean, (b) median,...
Ch. 3.2 - In Exercises 5-20, find the (a) mean, (b) median,...Ch. 3.2 - In Exercises 5-20, find the (a) mean, (b) median,...Ch. 3.2 - In Exercises 5-20, find the (a) mean, (b) median,...Ch. 3.2 - In Exercises 5-20, find the (a) mean, (b) median,...Ch. 3.2 - In Exercises 5-20, find the (a) mean, (b) median,...Ch. 3.2 - In Exercises 5-20, find the (a) mean, (b) median,...Ch. 3.2 - In Exercises 5-20, find the (a) mean, (b) median,...Ch. 3.2 - In Exercises 5-20, find the (a) mean, (b) median,...Ch. 3.2 - In Exercises 5-20, find the (a) mean, (b) median,...Ch. 3.2 - In Exercises 5-20, find the (a) mean, (b) median,...Ch. 3.2 - In Exercises 21-24, find the mean and median for...Ch. 3.2 - In Exercises 2124, find the mean and median for...Ch. 3.2 - In Exercises 21-24, find the mean and median for...Ch. 3.2 - In Exercises 21-24, find the mean and median for...Ch. 3.2 - Prob. 25BSCCh. 3.2 - Prob. 26BSCCh. 3.2 - Prob. 27BSCCh. 3.2 - Prob. 28BSCCh. 3.2 - Prob. 29BSCCh. 3.2 - Prob. 30BSCCh. 3.2 - Prob. 31BSCCh. 3.2 - Prob. 32BSCCh. 3.2 - 33. Degrees of Freedom Carbon monoxide is measured...Ch. 3.2 - Prob. 34BBCh. 3.2 - Prob. 35BBCh. 3.2 - Prob. 36BBCh. 3.2 - Prob. 37BBCh. 3.2 - Prob. 38BBCh. 3.2 - Prob. 39BBCh. 3.3 - Prob. 1BSCCh. 3.3 - 2. Correct Statements? Which of the following...Ch. 3.3 - 3. Variation and Variance In statistics, how do...Ch. 3.3 - 4. Symbols Identify the symbols used for each of...Ch. 3.3 - In Exercises 5–20, find the range, variance, and...Ch. 3.3 - In Exercises 5–20, find the range, variance, and...Ch. 3.3 - In Exercises 5–20, find the range, variance, and...Ch. 3.3 - In Exercises 5–20, find the range, variance, and...Ch. 3.3 - In Exercises 5–20, find the range, variance, and...Ch. 3.3 - In Exercises 5–20, find the range, variance, and...Ch. 3.3 - In Exercises 5–20, find the range, variance, and...Ch. 3.3 - In Exercises 5–20, find the range, variance, and...Ch. 3.3 - In Exercises 5–20, find the range, variance, and...Ch. 3.3 - In Exercises 5–20, find the range, variance, and...Ch. 3.3 - In Exercises 5–20, find the range, variance, and...Ch. 3.3 - In Exercises 5–20, find the range, variance, and...Ch. 3.3 - In Exercises 5–20, find the range, variance, and...Ch. 3.3 - Large Data Sets from Appendix B. In Exercises...Ch. 3.3 - In Exercises 5–20, find the range, variance, and...Ch. 3.3 - In Exercises 5–20, find the range, variance, and...Ch. 3.3 - Prob. 21BSCCh. 3.3 - In Exercises 2124, find the coefficient of...Ch. 3.3 - Prob. 23BSCCh. 3.3 - Prob. 24BSCCh. 3.3 - Prob. 25BSCCh. 3.3 - Prob. 26BSCCh. 3.3 - Prob. 27BSCCh. 3.3 - Prob. 28BSCCh. 3.3 - Prob. 29BSCCh. 3.3 - Prob. 30BSCCh. 3.3 - Prob. 31BSCCh. 3.3 - Prob. 32BSCCh. 3.3 - Prob. 33BSCCh. 3.3 - Identifying Unusual Values with the Range Rule of...Ch. 3.3 - Identifying Unusual Values with the Range Rule of...Ch. 3.3 - Identifying Unusual Values with the Range Rule of...Ch. 3.3 - Prob. 37BSCCh. 3.3 - Prob. 38BSCCh. 3.3 - Prob. 39BSCCh. 3.3 - Prob. 40BSCCh. 3.3 - Prob. 41BSCCh. 3.3 - Prob. 42BSCCh. 3.3 - Prob. 43BSCCh. 3.3 - Chebyshevs Theorem Based on Data Set 3 Body...Ch. 3.3 - Prob. 45BBCh. 3.3 - Prob. 46BBCh. 3.4 - Prob. 1BSCCh. 3.4 - z Scores If your score on your next statistics...Ch. 3.4 - 3. Boxplots Shown below is a STATDISK-generated...Ch. 3.4 - 4. Measures of Location The values of P50, Q2 and...Ch. 3.4 - z Scores. In Exercises 5-8, express all z scores...Ch. 3.4 - z Scores. In Exercises 5-8, express all z scores...Ch. 3.4 - z Scores. In Exercises 5-8, express all z scores...Ch. 3.4 - z Scores. In Exercises 5-8, express all z scores...Ch. 3.4 - Usual and Unusual Values. In Exercises 9-12,...Ch. 3.4 - Usual and Unusual Values. In Exercises 9-12,...Ch. 3.4 - Usual and Unusual Values. In Exercises 9-12,...Ch. 3.4 - Usual and Unusual Values. In Exercises 9-12,...Ch. 3.4 - Comparing Values. In Exercises 13-16, use z scores...Ch. 3.4 - Comparing Values. In Exercises 13-16, use z scores...Ch. 3.4 - Comparing Values. In Exercises 13-16, use z scores...Ch. 3.4 - Comparing Values. In Exercises 13-16, use z scores...Ch. 3.4 - Prob. 17BSCCh. 3.4 - Prob. 18BSCCh. 3.4 - Prob. 19BSCCh. 3.4 - Prob. 20BSCCh. 3.4 - In Exercises 21-28, use the same list of 24 sorted...Ch. 3.4 - In Exercises 21-28, use the same list of 24 sorted...Ch. 3.4 - In Exercises 21-28, use the same list of 24 sorted...Ch. 3.4 - In Exercises 21-28, use the same list of 24 sorted...Ch. 3.4 - In Exercises 21-28, use the same list of 24 sorted...Ch. 3.4 - In Exercises 21-28, use the same list of 24 sorted...Ch. 3.4 - In Exercises 21-28, use the same list of 24 sorted...Ch. 3.4 - In Exercises 21-28, use the same list of 24 sorted...Ch. 3.4 - Boxplots. In Exercises 29–32, use the given data...Ch. 3.4 - Boxplots. In Exercises 29–32, use the given data...Ch. 3.4 - Boxplots. In Exercises 29–32, use the given data...Ch. 3.4 - Boxplots. In Exercises 29–32, use the given data...Ch. 3.4 - Prob. 33BSCCh. 3.4 - Prob. 34BSCCh. 3.4 - Prob. 35BSCCh. 3.4 - Prob. 36BSCCh. 3.4 - Prob. 37BBCh. 3.4 - Prob. 38BBCh. 3 - Prob. 1CQQCh. 3 - Prob. 2CQQCh. 3 - Prob. 3CQQCh. 3 - Prob. 4CQQCh. 3 - Prob. 5CQQCh. 3 - Prob. 6CQQCh. 3 - Prob. 7CQQCh. 3 - Prob. 8CQQCh. 3 - Prob. 9CQQCh. 3 - Prob. 10CQQCh. 3 - Prob. 1RECh. 3 - Prob. 2RECh. 3 - Prob. 3RECh. 3 - Prob. 4RECh. 3 - Prob. 5RECh. 3 - Prob. 8RECh. 3 - Prob. 9RECh. 3 - Prob. 10RECh. 3 - Prob. 1CRECh. 3 - Prob. 2CRECh. 3 - Prob. 3CRECh. 3 - Prob. 5CRECh. 3 - Prob. 6CRECh. 3 - 7. Sampling Shortly after the World Trade Center...Ch. 3 - Prob. 8CRE
Knowledge Booster


Learn more about
Need a deep-dive on the concept behind this application? Look no further. Learn more about this topic, statistics and related others by exploring similar questions and additional content below.Similar questions
- You want to make a salad from whatever vegetable you have in the fridge. You have seven different tomatoes. There are 2 red tomatoes, 4 yellow tomatoes, and one black tomato in the fridge. You have three different bell peppers. There is 1 red pepper, 1 yellow pepper, and 1 green pepper. What is the probability of randomly choosing a vegetable and getting a red tomato, and a green pepper? Round your answer to four decimal places.arrow_forwarduppose automobile insurance companies gave annual premiums for top-rated companies in several states. The figure below shows box plots for the annual premium for urban customers in three states. Which state offers the lowest premium? Which state offers the highest premium?arrow_forwardWing Foot is a shoe franchise commonly found in shopping centers across the United States. Wing Foot knows that its stores will not show a profit unless they gross over $940,000 per year. Let A be the event that a new Wing Foot store grosses over $940,000 its first year. Let B be the event that a store grosses over $940,000 its second year. Wing Foot has an administrative policy of closing a new store if it does not show a profit in either of the first two years. Assume that the accounting office at Wing Foot provided the following information: 58% of all Wing Foot stores show a profit the first year; 72% of all Wing Foot store show a profit the second year (this includes stores that did not show a profit the first year); however, 86% of Wing Foot stores that showed a profit the first year also showed a profit the second year. Compute P(B|Ac). Round your answer to the nearest hundredth.arrow_forward
- You draw two cards from a standard deck of 52 cards, but before you draw the second card, you put the first one back and reshuffle the deck. If you get a3on the first card, find the probability of drawing a 3 for the second card.arrow_forwardDo bonds reduce the overall risk of an investment portfolio? Let x be a random variable representing annual percent return for the Vanguard Total Stock Index (all Stocks). Let y be a random variable representing annual return for the Vanguard Balanced Index (60% stock and 40% bond). For the past several years, assume the following data. Compute the coefficient of variation for each fund. Round your answers to the nearest tenth. x: 14 0 37 21 35 23 24 -14 -14 -17 y: 8 -2 29 17 22 17 17 -2 -3 -8arrow_forwardWhat percentage of the general U.S. population have bachelor's degrees? Suppose that the Statistical Abstract of the United States, 120th Edition, gives the following percentage of bachelor’s degrees by state. For convenience, the data are sorted in increasing order. 17 18 18 18 19 20 20 20 21 21 21 21 21 22 22 22 22 22 23 23 24 24 24 24 24 25 25 25 25 26 26 26 26 26 26 27 27 27 28 28 28 29 29 31 31 32 32 34 35 38 Illinois has a bachelor's degree percentage rate of about 18%. Into what quartile does this rate fall?arrow_forward
- What percentage of the general U.S. population have bachelor's degrees? Suppose that the Statistical Abstract of the United States, 120th Edition, gives the following percentage of bachelor’s degrees by state. For convenience, the data are sorted in increasing order. 17 18 18 18 19 20 20 20 21 21 21 21 21 22 22 22 22 22 23 23 24 24 24 24 24 25 25 25 25 26 26 26 26 26 26 27 27 27 28 28 28 29 29 31 31 32 32 34 35 38 Illinois has a bachelor's degree percentage rate of about 18%. Into what quartile does this rate fall?arrow_forwardFind the range for the following sample data. x 23 17 11 30 27arrow_forwardDo bonds reduce the overall risk of an investment portfolio? Let x be a random variable representing annual percent return for the Vanguard Total Stock Index (all Stocks). Let y be a random variable representing annual return for the Vanguard Balanced Index (60% stock and 40% bond). For the past several years, assume the following data. Compute the sample mean for x and for y. Round your answer to the nearest tenth. x: 11 0 36 22 34 24 25 -11 -11 -22 y: 9 -3 28 14 23 16 14 -3 -4 -9arrow_forward
- Do bonds reduce the overall risk of an investment portfolio? Let x be a random variable representing annual percent return for the Vanguard Total Stock Index (all Stocks). Let y be a random variable representing annual return for the Vanguard Balanced Index (60% stock and 40% bond). For the past several years, assume the following data. Compute the range for variable y. X 12 0 36 21 35 23 24 -12 -12 -21 Y 10 -2 26 15 22 18 15 -2 -3 -10arrow_forwardDo bonds reduce the overall risk of an investment portfolio? Let x be a random variable representing annual percent return for the Vanguard Total Stock Index (all Stocks). Let y be a random variable representing annual return for the Vanguard Balanced Index (60% stock and 40% bond). For the past several years, assume the following data. Compute the range for variable y. X 12 0 36 21 35 23 24 -12 -12 -21 Y 10 -2 26 15 22 18 15 -2 -3 -10arrow_forwardDo bonds reduce the overall risk of an investment portfolio? Let x be a random variable representing annual percent return for the Vanguard Total Stock Index (all Stocks). Let y be a random variable representing annual return for the Vanguard Balanced Index (60% stock and 40% bond). For the past several years, assume the following data. Compute the range for variable x. X 15 0 37 23 33 25 26 -15 -15 -23 Y 6 -1 28 18 24 17 18 -1 -2 -6arrow_forward
arrow_back_ios
SEE MORE QUESTIONS
arrow_forward_ios
Recommended textbooks for you
 Glencoe Algebra 1, Student Edition, 9780079039897...AlgebraISBN:9780079039897Author:CarterPublisher:McGraw Hill
 Holt Mcdougal Larson Pre-algebra: Student Edition...AlgebraISBN:9780547587776Author:HOLT MCDOUGALPublisher:HOLT MCDOUGAL
Glencoe Algebra 1, Student Edition, 9780079039897...
Algebra
ISBN:9780079039897
Author:Carter
Publisher:McGraw Hill
Holt Mcdougal Larson Pre-algebra: Student Edition...
Algebra
ISBN:9780547587776
Author:HOLT MCDOUGAL
Publisher:HOLT MCDOUGAL
Types of Data: Nominal, Ordinal, Interval/Ratio - Statistics Help; Author: Dr Nic's Maths and Stats;https://www.youtube.com/watch?v=hZxnzfnt5v8;License: Standard YouTube License, CC-BY
Statistics 1.1.2 Types of Data; Author: Dr. Jack L. Jackson II;https://www.youtube.com/watch?v=UZ4kHJOuoec;License: Standard YouTube License, CC-BY