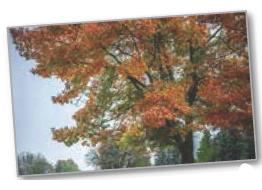
Arboriculture The growth of a red oak tree is approximated by the function G = – 0.003 t 3 + 0.137 t 2 + 0.458 t – 0.839 , 2 ≤ t ≤ 34 where G is the height of the tree (in feet) and t is its age (in years). (a) Use a graphing utility to graph the function. (b) Estimate the age of the tree when it is growing most rapidly. This point is called the point of diminishing returns because the increase in size will be less with each additional year. (c) Using calculus, the point of diminishing returns can be found by finding the vertex of the parabola y = – 0.009 t 2 + 0.274 t + 0.458. Find the vertex of this parabola. (d) Compare your results from parts (b) and (c).
Arboriculture The growth of a red oak tree is approximated by the function G = – 0.003 t 3 + 0.137 t 2 + 0.458 t – 0.839 , 2 ≤ t ≤ 34 where G is the height of the tree (in feet) and t is its age (in years). (a) Use a graphing utility to graph the function. (b) Estimate the age of the tree when it is growing most rapidly. This point is called the point of diminishing returns because the increase in size will be less with each additional year. (c) Using calculus, the point of diminishing returns can be found by finding the vertex of the parabola y = – 0.009 t 2 + 0.274 t + 0.458. Find the vertex of this parabola. (d) Compare your results from parts (b) and (c).
The growth of a red oak tree is approximated by the function
G
=
–
0.003
t
3
+
0.137
t
2
+
0.458
t
–
0.839
,
2
≤
t
≤
34
where
G
is the height of the tree (in feet) and
t
is its age (in years).
(a) Use a graphing utility to graph the function.
(b) Estimate the age of the tree when it is growing most rapidly. This point is called the point ofdiminishing returns because the increase in size will be less with each additional year.
(c) Using calculus, the point of diminishing returns can be found by finding the vertex of the parabola
For each graph below, state whether it represents a function.
Graph 1
24y
Graph 2
Graph 3
4
2
-8
-6 -4
-2
-2
2 4 6
Function?
○ Yes
○ No
○ Yes
○ No
Graph 4
Graph 5
8
Function?
Yes
No
Yes
No
-2.
○ Yes
○ No
Graph 6
4
+
2
4
-8 -6 -4 -2
2 4 6
8
Yes
-4++
No
Practice
k Help
ises
A
96
Anewer The probability that you get a sum of at least 10 is
Determine the number of ways that the specified event can occur when
two number cubes are rolled.
1. Getting a sum of 9 or 10
3. Getting a sum less than 5
2. Getting a sum of 6 or 7
4. Getting a sum that is odd
Tell whether you would use the addition principle or the multiplication
principle to determine the total number of possible outcomes for the
situation described.
5. Rolling three number cubes
6. Getting a sum of 10 or 12 after rolling three number cubes
A set of playing cards contains four groups of cards designated by color
(black, red, yellow, and green) with cards numbered from 1 to 14 in each
group. Determine the number of ways that the specified event can occur
when a card is drawn from the set.
7. Drawing a 13 or 14
9. Drawing a number less than 4
8. Drawing a yellow or green card
10. Drawing a black, red, or green car
The spinner is divided into equal parts.
Find the specified…
Answer the questions
Chapter 3 Solutions
College Algebra Real Mathematics Real People Edition 7
Need a deep-dive on the concept behind this application? Look no further. Learn more about this topic, algebra and related others by exploring similar questions and additional content below.


 Algebra & Trigonometry with Analytic GeometryAlgebraISBN:9781133382119Author:SwokowskiPublisher:Cengage
 Glencoe Algebra 1, Student Edition, 9780079039897...AlgebraISBN:9780079039897Author:CarterPublisher:McGraw Hill
 Trigonometry (MindTap Course List)TrigonometryISBN:9781337278461Author:Ron LarsonPublisher:Cengage Learning

 College AlgebraAlgebraISBN:9781305115545Author:James Stewart, Lothar Redlin, Saleem WatsonPublisher:Cengage Learning