Experts fear that without conservation efforts, tigers could disappear from the wild by 2022. Just one hundred years ago, there were at least 100,000 wild tigers. By 2010, the estimated world tiger population was 3200. The bar graph shows the estimated world tiger population for selected years from 1970 through 2010. Also shown is a polynomial function, with its graph, that models the data. Use this information to solve Exercises 73-74. a. Find and interpret f (40). Identify this information as a point on the graph of. f b. Does f (40) overestimate or underestimate the actual data shown by the bar graph? By how much? c. Use the Leading Coefficient Test to determine the end behavior to the right for the graph of f Will this function be useful in modeling the world tiger population if conservation efforts to save wild tigers fail? Explain your answer.
Experts fear that without conservation efforts, tigers could disappear from the wild by 2022. Just one hundred years ago, there were at least 100,000 wild tigers. By 2010, the estimated world tiger population was 3200. The bar graph shows the estimated world tiger population for selected years from 1970 through 2010. Also shown is a polynomial function, with its graph, that models the data. Use this information to solve Exercises 73-74. a. Find and interpret f (40). Identify this information as a point on the graph of. f b. Does f (40) overestimate or underestimate the actual data shown by the bar graph? By how much? c. Use the Leading Coefficient Test to determine the end behavior to the right for the graph of f Will this function be useful in modeling the world tiger population if conservation efforts to save wild tigers fail? Explain your answer.
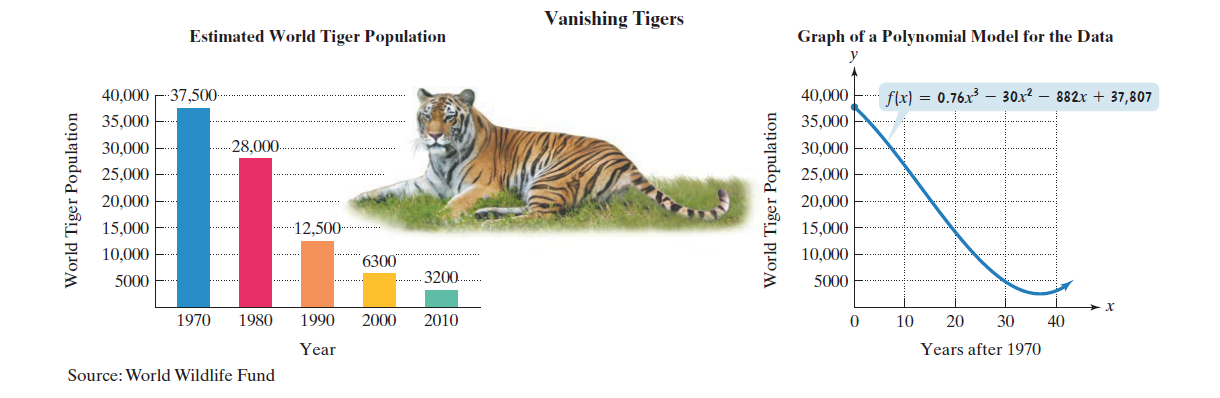
Solution Summary: The author explains how the polynomial function underestimates the world tiger population in 2010.
Experts fear that without conservation efforts, tigers could disappear from the wild by 2022. Just one hundred years ago, there were at least 100,000 wild tigers. By 2010, the estimated world tiger population was 3200. The bar graph shows the estimated world tiger population for selected years from 1970 through 2010. Also shown is a polynomial function, with its graph, that models the data. Use this information to solve Exercises 73-74.
a. Find and interpret f(40). Identify this information as a point on the graph of. f
b. Does f(40) overestimate or underestimate the actual data shown by the bar graph? By how much?
c. Use the Leading Coefficient Test to determine the end behavior to the right for the graph of f Will this function be useful in modeling the world tiger population if conservation efforts to save wild tigers fail? Explain your answer.
Suppose you flip a fair two-sided coin four times and record the result.
a). List the sample space of this experiment. That is, list all possible outcomes that could
occur when flipping a fair two-sided coin four total times. Assume the two sides of the coin are
Heads (H) and Tails (T).
Need a deep-dive on the concept behind this application? Look no further. Learn more about this topic, algebra and related others by exploring similar questions and additional content below.


 Algebra & Trigonometry with Analytic GeometryAlgebraISBN:9781133382119Author:SwokowskiPublisher:Cengage
 College Algebra (MindTap Course List)AlgebraISBN:9781305652231Author:R. David Gustafson, Jeff HughesPublisher:Cengage Learning

 Glencoe Algebra 1, Student Edition, 9780079039897...AlgebraISBN:9780079039897Author:CarterPublisher:McGraw Hill
 Big Ideas Math A Bridge To Success Algebra 1: Stu...AlgebraISBN:9781680331141Author:HOUGHTON MIFFLIN HARCOURTPublisher:Houghton Mifflin Harcourt