
Concept explainers
Videos
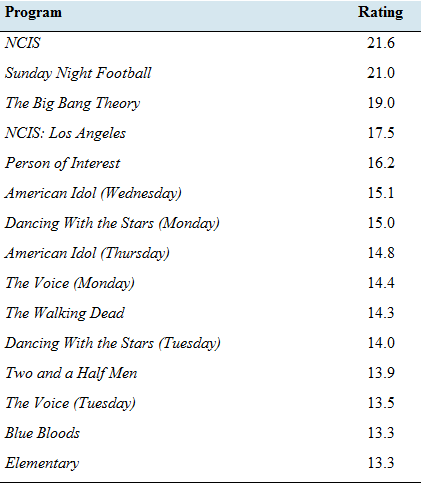
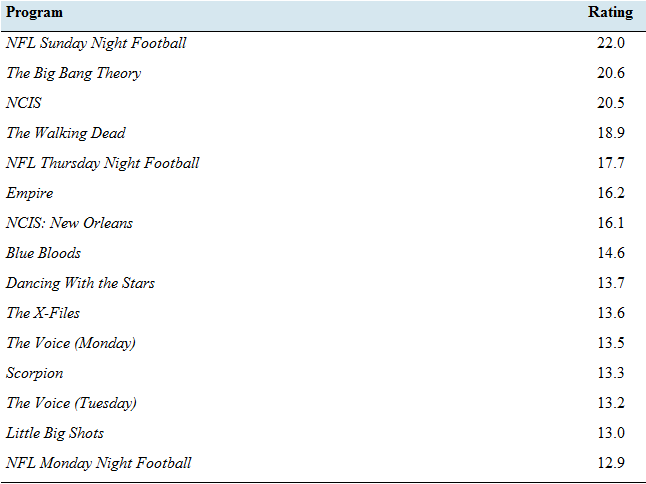
What’s your favorite TV show? The following tables present the numbers of viewers, in millions for the top 15 prime-time shows for the 2012—2013 and 2015—2016 seasons. The numbers of viewers include those who watched the program on any platform, including time-shifting up to seven days after the original telecast.

- Find the population standard deviation of the ratings for 20 12—2013.
- Find the population standard deviation of the ratings for 2015—2016.
- Compute the
range for the ratings for both seasons. - Based on the standard deviations, did the spread in ratings increase or decrease over the two seasons?
- Based on the ranges, did the spread in ratings increase or decrease over the two seasons?
a)
To find: the sample standard deviation of rating 2012 − 2013.
Answer to Problem 39E
Standard deviation = 2.74
Explanation of Solution
Given:
| Top Rated TV Programs: 2012−2013 | Top Rated TV Programs: 2015−2016 | ||
| Program | Rating | Program | Rating |
| NCIS | 21.6 | NFL Sunday Night Football | 22 |
| Sunday Night Football | 21 | The Big Bang Theory | 20.6 |
| The Big Bang Theory | 19 | NCIS | 20.5 |
| NCIS: Los Angeles | 17.5 | The Walking Dead | 18.9 |
| Person of Interest | 16.2 | NFL Thursday Night Football | 17.7 |
| American Idol (Wednesday) | 15.1 | Empire | 16.2 |
| Dancing with the Stars (Monday) | 15 | NCIS: New Orleans | 16.1 |
| American Idol (Thursday) | 14.8 | Blue Bloods | 14.6 |
| The Voice (Monday) | 14.4 | Dancing with the Stars | 13.7 |
| The Walking Dead | 14.3 | The X-Files | 13.6 |
| Dancing with the Stars (Tuesday) | 14 | The Voice (Monday) | 13.5 |
| Two and a Half Men | 13.9 | Scorpion | 13.3 |
| The Voice (Tuesday) | 13.5 | The Voice (Tuesday) | 13.2 |
| Blue Bloods | 13.3 | Little Big Shots | 13 |
| Elementary | 13.3 | NFL Monday Night Football | 12.9 |
Formula used:
Calculation:
| Top Rated TV Programs: 2012−2013 | ||
| Program | Rating | |
| NCIS | 21.6 | 33.72 |
| Sunday Night Football | 21 | 27.11 |
| The Big Bang Theory | 19 | 10.28 |
| NCIS: Los Angeles | 17.5 | 2.91 |
| Person of Interest | 16.2 | 0.17 |
| American Idol (Wednesday) | 15.1 | 0.48 |
| Dancing with the Stars (Monday) | 15 | 0.63 |
| American Idol (Thursday) | 14.8 | 0.99 |
| The Voice (Monday) | 14.4 | 1.94 |
| The Walking Dead | 14.3 | 2.23 |
| Dancing with the Stars (Tuesday) | 14 | 3.22 |
| Two and a Half Men | 13.9 | 3.58 |
| The Voice (Tuesday) | 13.5 | 5.26 |
| Blue Bloods | 13.3 | 6.22 |
| Elementary | 13.3 | 6.22 |
| Sum | 236.90 | 104.95 |
| average | 15.79 | |
| Standard deviation | 2.74 | |
b)
To find: the sample standard deviation for the rating in year 2015 − 2016.
Answer to Problem 39E
Standard deviation = 3.18
Explanation of Solution
Calculation:
| Top Rated TV Programs: 2015−2016 | ||
| Program | Rating | |
| NFL Sunday Night Football | 22 | 36.16 |
| The Big Bang Theory | 20.6 | 21.28 |
| NCIS | 20.5 | 20.37 |
| The Walking Dead | 18.9 | 8.49 |
| NFL Thursday Night Football | 17.7 | 2.94 |
| Empire | 16.2 | 0.05 |
| NCIS: New Orleans | 16.1 | 0.01 |
| Blue Bloods | 14.6 | 1.92 |
| Dancing with the Stars | 13.7 | 5.23 |
| The X-Files | 13.6 | 5.70 |
| The Voice (Monday) | 13.5 | 6.18 |
| Scorpion | 13.3 | 7.22 |
| The Voice (Tuesday) | 13.2 | 7.77 |
| Little Big Shots | 13 | 8.92 |
| NFL Monday Night Football | 12.9 | 9.53 |
| Sum | 239.8 | 141.76 |
| average | 15.99 | |
| Standard deviation | 3.18 | |
c)
To find: the range of ratings for both years.
Answer to Problem 39E
Range:
2012 − 13 = 8.3
2015 − 15 = 9.1
Explanation of Solution
Formula used:
Range = Highest Value − lowest value
Calculation:
d)
To explain: whether the spread has increase or decrease based on standard deviation of both years.
Answer to Problem 39E
Increased
Explanation of Solution
Since the standard deviation in 2012 − 2013 is 2.74 and in year 2015 − 2016 it is 3.18, which shows that the spread of rating has increased over the given time periods.
e)
To explain: whether the spread has increase or decrease based on standard deviation of both years.
Answer to Problem 39E
Increased
Explanation of Solution
Since the Range in 2012 − 2013 is 8.3 and in year 2015 − 2016 it is 9.1, which shows that the spread of rating has increased over the given time periods.
Want to see more full solutions like this?
Chapter 3 Solutions
Connect Hosted by ALEKS Online Access for Elementary Statistics


- 10. Prove that, if (t)=1+0(12) as asf->> O is a characteristic function, then p = 1.arrow_forward9. The concentration function of a random variable X is defined as Qx(h) sup P(x ≤x≤x+h), h>0. (b) Is it true that Qx(ah) =aQx (h)?arrow_forward3. Let X1, X2,..., X, be independent, Exp(1)-distributed random variables, and set V₁₁ = max Xk and W₁ = X₁+x+x+ Isk≤narrow_forward
- 7. Consider the function (t)=(1+|t|)e, ER. (a) Prove that is a characteristic function. (b) Prove that the corresponding distribution is absolutely continuous. (c) Prove, departing from itself, that the distribution has finite mean and variance. (d) Prove, without computation, that the mean equals 0. (e) Compute the density.arrow_forward1. Show, by using characteristic, or moment generating functions, that if fx(x) = ½ex, -∞0 < x < ∞, then XY₁ - Y2, where Y₁ and Y2 are independent, exponentially distributed random variables.arrow_forward1. Show, by using characteristic, or moment generating functions, that if 1 fx(x): x) = ½exarrow_forward
- 1990) 02-02 50% mesob berceus +7 What's the probability of getting more than 1 head on 10 flips of a fair coin?arrow_forward9. The concentration function of a random variable X is defined as Qx(h) sup P(x≤x≤x+h), h>0. = x (a) Show that Qx+b(h) = Qx(h).arrow_forwardSuppose that you buy a lottery ticket, and you have to pick six numbers from 1 through 50 (repetitions allowed). Which combination is more likely to win: 13, 48, 17, 22, 6, 39 or 1, 2, 3, 4, 5, 6? barrow_forward
- 2 Make a histogram from this data set of test scores: 72, 79, 81, 80, 63, 62, 89, 99, 50, 78, 87, 97, 55, 69, 97, 87, 88, 99, 76, 78, 65, 77, 88, 90, and 81. Would a pie chart be appropriate for this data? ganizing Quantitative Data: Charts and Graphs 45arrow_forward10 Meteorologists use computer models to predict when and where a hurricane will hit shore. Suppose they predict that hurricane Stat has a 20 percent chance of hitting the East Coast. a. On what info are the meteorologists basing this prediction? b. Why is this prediction harder to make than your chance of getting a head on your next coin toss? U anoiaarrow_forward6. Show that one cannot find independent, identically distributed random variables X and Y such that X-YE U(-1, 1). 7 Consider al onarrow_forward
 Big Ideas Math A Bridge To Success Algebra 1: Stu...AlgebraISBN:9781680331141Author:HOUGHTON MIFFLIN HARCOURTPublisher:Houghton Mifflin Harcourt
 Glencoe Algebra 1, Student Edition, 9780079039897...AlgebraISBN:9780079039897Author:CarterPublisher:McGraw Hill
 Holt Mcdougal Larson Pre-algebra: Student Edition...AlgebraISBN:9780547587776Author:HOLT MCDOUGALPublisher:HOLT MCDOUGAL
 College Algebra (MindTap Course List)AlgebraISBN:9781305652231Author:R. David Gustafson, Jeff HughesPublisher:Cengage Learning