Videos
a.
Find the
Check whether the data are consistent with the National Retail Federation’s report.
a.
Answer to Problem 32E
The mean back-to-school expenditure for Freshman is 1,285 and the mean back-to-school expenditure for Seniors is 433.
Yes, the data are consistent with the National Retail Federation’s report.
Explanation of Solution
Calculation:
The given information is a sample data comparing the back-to-school expenditures for 25 freshmen and 20 seniors.
Software Procedure:
Step by step procedure to obtain the mean using the MINITAB software:
- Choose Stat > Basic Statistics > Display
Descriptive Statistics . - In Variables enter the columns Freshman and Seniors.
- In Statistics select mean.
- Click OK.
Output using the MINITAB software is given below:
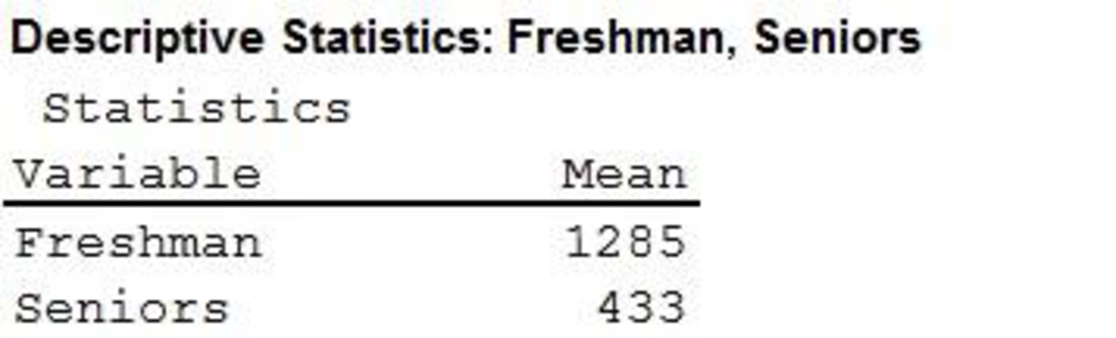
Thus, the mean back-to-school expenditure for Freshman is 1,285 and for Seniors is 433.
The data are consistent with the National Retail Federation’s report because the mean back-to-school expenditure for Freshman is higher than Seniors.
b.
Find the
b.
Answer to Problem 32E
The range for the expenditures in Freshman is 1,720 and for Seniors is 352.
Explanation of Solution
Calculation:
The range is calculated as follows:
Software Procedure:
Step by step procedure to obtain the range using the MINITAB software:
- Choose Stat > Basic Statistics > Display Descriptive Statistics.
- In Variables enter the columns Freshman and Seniors.
- In Statistics select Range.
- Click OK.
Output using the MINITAB software is given below:
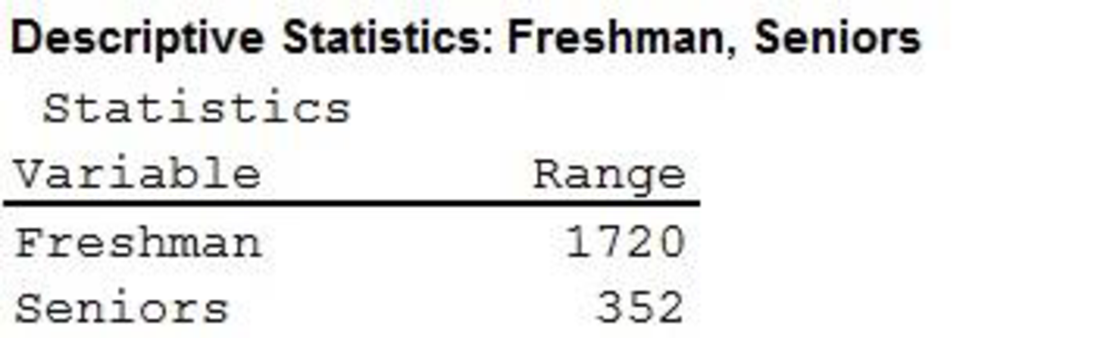
Thus, the range for the expenditures in Freshman is 1,720 and for Seniors is 352.
c.
Find the
c.
Answer to Problem 32E
The interquartile range for Freshman is 404 and for Seniors is 131.5.
Explanation of Solution
Calculation:
The formula for the location of
where n is the
For Freshmen:
The 25th percentile is calculated as follows:
Here, i is not an integer. Therefore, the 25th percentile is the next integer greater than i. That is, the position of the 25th percentile is 7th position.
Thus, the first
The 75th percentile is calculated as follows:
That is, the position of the 75th percentile is 19th position.
Thus, the third quartile is 1,475.
The IQR can be obtained as follows:
Substitute
Thus, the IQR is 404.
Thus, the interquartile range for Freshman is 404.
For Seniors:
The 25th percentile is calculated as follows:
Here, i is an integer. Therefore, the 25th percentile is the average of the values in the positions i and i+1.
The 25th percentile is obtained below:
Thus, the first quartile is 370.5.
The 75th percentile is calculated as follows:
Here, i is an integer. Therefore, the 75th percentile is the average of the values in the positions i and i+1.
The 75th percentile is obtained below:
Thus, the third quartile is 502.
The IQR can be obtained as follows:
Substitute
Thus, the IQR is 131.5.
Thus, the interquartile range for Seniors is 131.5.
d.
Find the standard deviation for the expenditures in each group.
d.
Answer to Problem 32E
The standard deviation for the expenditures in Freshman is 367 and Seniors is 97.
Explanation of Solution
Calculation:
The standard deviation is calculated as follows:
Software Procedure:
Step by step procedure to obtain the standard deviation using the MINITAB software:
- Choose Stat > Basic Statistics > Display Descriptive Statistics.
- In Variables enter the columns Freshman and Seniors.
- In Statistics select Standard deviation.
- Click OK.
Output using the MINITAB software is given below:
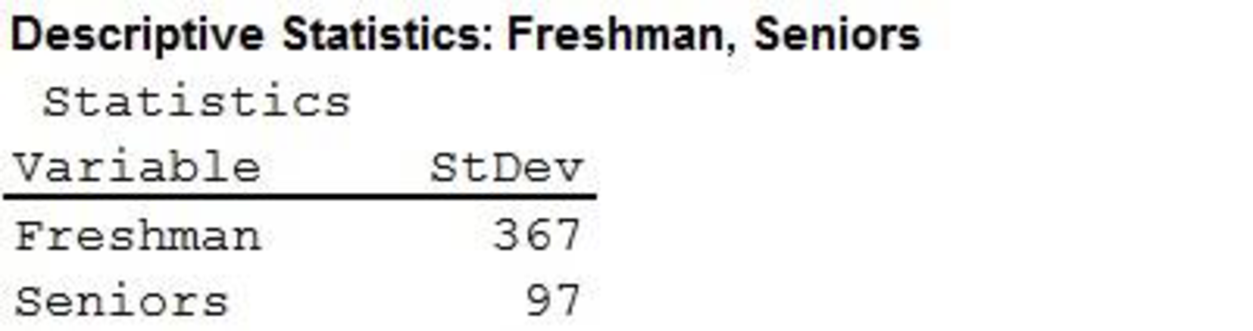
Thus, the standard deviation for the expenditures in Freshman is 367 and Seniors is 97.
e.
Explain whether freshmen or seniors have more variation in back-to-school expenditures.
e.
Explanation of Solution
From parts (b) to (d), all measures of variability suggest that freshmen have more variation in back-to-school expenditures.
Want to see more full solutions like this?
Chapter 3 Solutions
Statistics for Business & Economics


- I worked out the answers for most of this, and provided the answers in the tables that follow. But for the total cost table, I need help working out the values for 10%, 11%, and 12%. A pharmaceutical company produces the drug NasaMist from four chemicals. Today, the company must produce 1000 pounds of the drug. The three active ingredients in NasaMist are A, B, and C. By weight, at least 8% of NasaMist must consist of A, at least 4% of B, and at least 2% of C. The cost per pound of each chemical and the amount of each active ingredient in one pound of each chemical are given in the data at the bottom. It is necessary that at least 100 pounds of chemical 2 and at least 450 pounds of chemical 3 be used. a. Determine the cheapest way of producing today’s batch of NasaMist. If needed, round your answers to one decimal digit. Production plan Weight (lbs) Chemical 1 257.1 Chemical 2 100 Chemical 3 450 Chemical 4 192.9 b. Use SolverTable to see how much the percentage of…arrow_forwardAt the beginning of year 1, you have $10,000. Investments A and B are available; their cash flows per dollars invested are shown in the table below. Assume that any money not invested in A or B earns interest at an annual rate of 2%. a. What is the maximized amount of cash on hand at the beginning of year 4.$ ___________ A B Time 0 -$1.00 $0.00 Time 1 $0.20 -$1.00 Time 2 $1.50 $0.00 Time 3 $0.00 $1.90arrow_forwardFor each of the time series, construct a line chart of the data and identify the characteristics of the time series (that is, random, stationary, trend, seasonal, or cyclical). Year Month Rate (%)2009 Mar 8.72009 Apr 9.02009 May 9.42009 Jun 9.52009 Jul 9.52009 Aug 9.62009 Sep 9.82009 Oct 10.02009 Nov 9.92009 Dec 9.92010 Jan 9.82010 Feb 9.82010 Mar 9.92010 Apr 9.92010 May 9.62010 Jun 9.42010 Jul 9.52010 Aug 9.52010 Sep 9.52010 Oct 9.52010 Nov 9.82010 Dec 9.32011 Jan 9.12011 Feb 9.02011 Mar 8.92011 Apr 9.02011 May 9.02011 Jun 9.12011 Jul 9.02011 Aug 9.02011 Sep 9.02011 Oct 8.92011 Nov 8.62011 Dec 8.52012 Jan 8.32012 Feb 8.32012 Mar 8.22012 Apr 8.12012 May 8.22012 Jun 8.22012 Jul 8.22012 Aug 8.12012 Sep 7.82012 Oct…arrow_forward
- For each of the time series, construct a line chart of the data and identify the characteristics of the time series (that is, random, stationary, trend, seasonal, or cyclical). Date IBM9/7/2010 $125.959/8/2010 $126.089/9/2010 $126.369/10/2010 $127.999/13/2010 $129.619/14/2010 $128.859/15/2010 $129.439/16/2010 $129.679/17/2010 $130.199/20/2010 $131.79 a. Construct a line chart of the closing stock prices data. Choose the correct chart below.arrow_forwardFor each of the time series, construct a line chart of the data and identify the characteristics of the time series (that is, random, stationary, trend, seasonal, or cyclical) Date IBM9/7/2010 $125.959/8/2010 $126.089/9/2010 $126.369/10/2010 $127.999/13/2010 $129.619/14/2010 $128.859/15/2010 $129.439/16/2010 $129.679/17/2010 $130.199/20/2010 $131.79arrow_forward1. A consumer group claims that the mean annual consumption of cheddar cheese by a person in the United States is at most 10.3 pounds. A random sample of 100 people in the United States has a mean annual cheddar cheese consumption of 9.9 pounds. Assume the population standard deviation is 2.1 pounds. At a = 0.05, can you reject the claim? (Adapted from U.S. Department of Agriculture) State the hypotheses: Calculate the test statistic: Calculate the P-value: Conclusion (reject or fail to reject Ho): 2. The CEO of a manufacturing facility claims that the mean workday of the company's assembly line employees is less than 8.5 hours. A random sample of 25 of the company's assembly line employees has a mean workday of 8.2 hours. Assume the population standard deviation is 0.5 hour and the population is normally distributed. At a = 0.01, test the CEO's claim. State the hypotheses: Calculate the test statistic: Calculate the P-value: Conclusion (reject or fail to reject Ho): Statisticsarrow_forward
- 21. find the mean. and variance of the following: Ⓒ x(t) = Ut +V, and V indepriv. s.t U.VN NL0, 63). X(t) = t² + Ut +V, U and V incepires have N (0,8) Ut ①xt = e UNN (0162) ~ X+ = UCOSTE, UNNL0, 62) SU, Oct ⑤Xt= 7 where U. Vindp.rus +> ½ have NL, 62). ⑥Xn = ΣY, 41, 42, 43, ... Yn vandom sample K=1 Text with mean zen and variance 6arrow_forwardA psychology researcher conducted a Chi-Square Test of Independence to examine whether there is a relationship between college students’ year in school (Freshman, Sophomore, Junior, Senior) and their preferred coping strategy for academic stress (Problem-Focused, Emotion-Focused, Avoidance). The test yielded the following result: image.png Interpret the results of this analysis. In your response, clearly explain: Whether the result is statistically significant and why. What this means about the relationship between year in school and coping strategy. What the researcher should conclude based on these findings.arrow_forwardA school counselor is conducting a research study to examine whether there is a relationship between the number of times teenagers report vaping per week and their academic performance, measured by GPA. The counselor collects data from a sample of high school students. Write the null and alternative hypotheses for this study. Clearly state your hypotheses in terms of the correlation between vaping frequency and academic performance. EditViewInsertFormatToolsTable 12pt Paragrapharrow_forward
- A smallish urn contains 25 small plastic bunnies – 7 of which are pink and 18 of which are white. 10 bunnies are drawn from the urn at random with replacement, and X is the number of pink bunnies that are drawn. (a) P(X = 5) ≈ (b) P(X<6) ≈ The Whoville small urn contains 100 marbles – 60 blue and 40 orange. The Grinch sneaks in one night and grabs a simple random sample (without replacement) of 15 marbles. (a) The probability that the Grinch gets exactly 6 blue marbles is [ Select ] ["≈ 0.054", "≈ 0.043", "≈ 0.061"] . (b) The probability that the Grinch gets at least 7 blue marbles is [ Select ] ["≈ 0.922", "≈ 0.905", "≈ 0.893"] . (c) The probability that the Grinch gets between 8 and 12 blue marbles (inclusive) is [ Select ] ["≈ 0.801", "≈ 0.760", "≈ 0.786"] . The Whoville small urn contains 100 marbles – 60 blue and 40 orange. The Grinch sneaks in one night and grabs a simple random sample (without replacement) of 15 marbles. (a)…arrow_forwardSuppose an experiment was conducted to compare the mileage(km) per litre obtained by competing brands of petrol I,II,III. Three new Mazda, three new Toyota and three new Nissan cars were available for experimentation. During the experiment the cars would operate under same conditions in order to eliminate the effect of external variables on the distance travelled per litre on the assigned brand of petrol. The data is given as below: Brands of Petrol Mazda Toyota Nissan I 10.6 12.0 11.0 II 9.0 15.0 12.0 III 12.0 17.4 13.0 (a) Test at the 5% level of significance whether there are signi cant differences among the brands of fuels and also among the cars. [10] (b) Compute the standard error for comparing any two fuel brands means. Hence compare, at the 5% level of significance, each of fuel brands II, and III with the standard fuel brand I. [10] �arrow_forwardBusiness discussarrow_forward
 Big Ideas Math A Bridge To Success Algebra 1: Stu...AlgebraISBN:9781680331141Author:HOUGHTON MIFFLIN HARCOURTPublisher:Houghton Mifflin Harcourt
 Glencoe Algebra 1, Student Edition, 9780079039897...AlgebraISBN:9780079039897Author:CarterPublisher:McGraw Hill
 Holt Mcdougal Larson Pre-algebra: Student Edition...AlgebraISBN:9780547587776Author:HOLT MCDOUGALPublisher:HOLT MCDOUGAL