
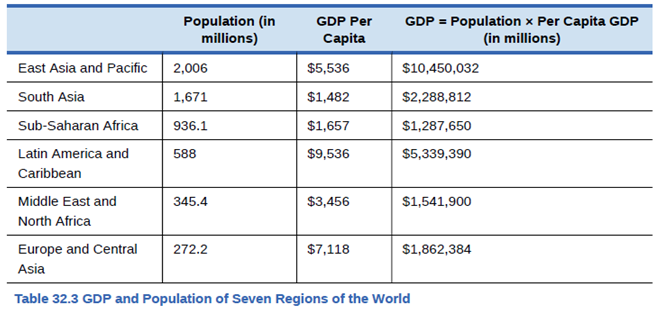
Using the data in Table 32.3, rank the seven regions of the world according to
The rank:
The given regions of the world according to the GDP and then according to the GDP per capita
Explanation of Solution
As per the table given, the rankings are as follows:
| Countries | Population
|
GDP per capita
|
Ranking as GDP | |
| East Asia and Pacific | I | |||
| Latin America and Caribbean | II | |||
| South Asia | III | |||
| Europe and Central Asia | IV | |||
| Middle East and North Africa | V | |||
| Sub-Saharan Asia | VI |
| Countries | Population
|
GDP per capita
|
Ranking as GDP per capita | |
| Latin America and Caribbean | I | |||
| Europe and Central Asia | II | |||
| East Asia and Pacific | III | |||
| Middle East and North Africa | IV | |||
| Sub-Saharan Asia | V | |||
| South Asia | VI |
Economist measures a nation’s standard of living through its GDP per capita. GDP measures annual economic output that is total value of goods and services produced within a country.
The low-income countries are those which are having GDP per capita income less than
Want to see more full solutions like this?
Chapter 32 Solutions
Principles of Economics 2e
Additional Business Textbook Solutions
Horngren's Financial & Managerial Accounting, The Financial Chapters (Book & Access Card)
Gitman: Principl Manageri Finance_15 (15th Edition) (What's New in Finance)
Foundations Of Finance
MARKETING:REAL PEOPLE,REAL CHOICES
Corporate Finance (4th Edition) (Pearson Series in Finance) - Standalone book
Horngren's Accounting (12th Edition)

- According to the relative purchasing power parity theory, high inflation in country A and low inflation in country B will cause the value of country A's currency to appreciate relative to that of country B. Question 1 options: True Falsearrow_forwardHow might different tax structures influence consumer behavior in luxury versus essential goods?arrow_forwardWhat is a competitive market?arrow_forward
- لا. Assignniend abcpain the the three type of state- and explaining of the decannolly you know + 29 Explain Cu Marginal utility Jaw State the lid of diminishing. Explain the Concept of the aid of ha the relations and marginal uitity. Marginal finishing حومarrow_forwardHow does the change in consumer and producer surplus compare with the tax revenue?arrow_forwardConsidering the following supply and demand equations: Qs=3P-1 Qd=-2P+9 dPdt=0.5(Qd-Qs) Find the expressions: P(t), Qs(t) and Qd(t). When P(0)=1, is the system stable or unstable? If the constant for the change of excess of demand changes to 0.6, this is: dPdt=0.6(Qd-Qs) do P(t), Qs(t) and Qd(t) remain the same when P(0)=1?arrow_forward
- Consider the following supply and demand schedule of wooden tables.a. Draw the corresponding graphs for supply and demand. b. Using the data, obtain the corresponding supply and demand functions. c. Find the market-clearing price and quantity. Price (Thousands USD) Supply Demand2 96 1104 196 1906 296 270 8 396 35010 496 43012 596 51014 696 59016 796 67018 896 75020 996 830arrow_forwardWhat happens to consumer surplus and producer surplus when the sale of a good is taxed?arrow_forwardEconomics Grade 3 CONDUCT RESEARCH ON (the various) MARKET STRUCTURES Research Project/May Explain the concept market structure and explain why there are perfect and imperfect market structures. (5) • Provide reasons as to why the taxi industry is regarded as operating in a monopolistic competitive structure. (10) • How do monopolies impact consumers and the economy. (10) • Use graph(s) to explain the long run equilibrium price and output in a perfect market. (10) • Evaluate the effectiveness of South Africa's competition policy in curbing anticompetitive tendencies in the market. Make use of practical examples. (10) GRAND TOTAL:50 Please turn Copyrightarrow_forward
- UGD KCQ 2: Microeconomic Essentials (page 11 of 20) - Google Chrome mancosaconnect.ac.za/mod/quiz/attempt.php?attempt=1958913&cmid=436375&page=10 MANCOSA Microeconomic Essentials Jan25 Y1 S1 Back Refer to the diagram below to answer the question that follows: Price PH P1 D₁ ㅁ X Quiz navigation 3 4 5 6 Time left 0:58:34 1 2 Question 11 7 8 Not yet answered Marked out of 1.00 13 33 14 S₁ Flag question Q Q1 Quantity Which of the following may result in a shift of the supply curve from S to S1? OA. An increase in price of the good. B. An increase in wages. O C. A decrease in price of the good. O D. An improvement in the technique of production. https://mancosaconnect.ac.za/mod/quiz/attempt.php?attempt=1958913&cmid=436375&page=10#question-2064270-11 19 20 6 10 10 11 12 15 Question 11- Not yet answered Finish attempt... 7:31 PMarrow_forwardEuros per U.S. Doler Consider the model below, showing the supply and demand curves for the exchange market of U.S. Dollars and Euros. If the inflation rate in the U.S. increases (and in the European Union stays the same), how will that change the original equilibrium shown in the graph? 1.10- 1.00- 0.90 0.80- 0.70 0.60 0.50- 0.40- 0.30 0.20 E 4.7 48 49 50 51 52 53 54 55 56 Quantity of U.S. Dollars traded for Euros (trillionsday) O It will decrease the demand for Dollars and increase the supply, so the exchange rate decreases and the impact on the quantity traded is unknown. O It will decrease the demand for Dollars and increase the supply, so the exchange rate decreases, and the quantity traded increases. It will increase the demand for Dollars and decrease the supply, so the exchange rate decreases, and the quantity traded increases. It will increase the demand for Dollars and decrease the supply, so the exchange rate increases and the impact on the quantity traded is unknownarrow_forwardIf the US Federal Reserve increases interests on reserves, how will that change the original equilibrium shown in the graph? Euros par US alar 1.10 1.00 0.90- E 0.80- 0.70 0.60 0.50 0.40- 0.30 0.20 47 48 49 50 51 52 53 54 55 56 Quantity of US Dollars traded for Euros (trillions/day) It will increase the demand for Dollars and decrease the supply, so the exchange rate decreases, and the quantity traded increases. O It will decrease the demand for Dollars and increase the supply, so the exchange rate decreases and the impact on the quantity traded is unknown. O It will increase the demand for Dollars and decrease the supply, so the exchange rate increases and the impact on the quantity traded is unknown O It will decrease the demand for Dollars and increase the supply, so the exchange rate decreases, and the quantity traded increases. Question 22 5 ptsarrow_forward


 Principles of Economics 2eEconomicsISBN:9781947172364Author:Steven A. Greenlaw; David ShapiroPublisher:OpenStax
 Economics (MindTap Course List)EconomicsISBN:9781337617383Author:Roger A. ArnoldPublisher:Cengage Learning