
Concept explainers
To review:
The relationship between viviparity and cold climates, based on the given phylogenetic tree.
Given:
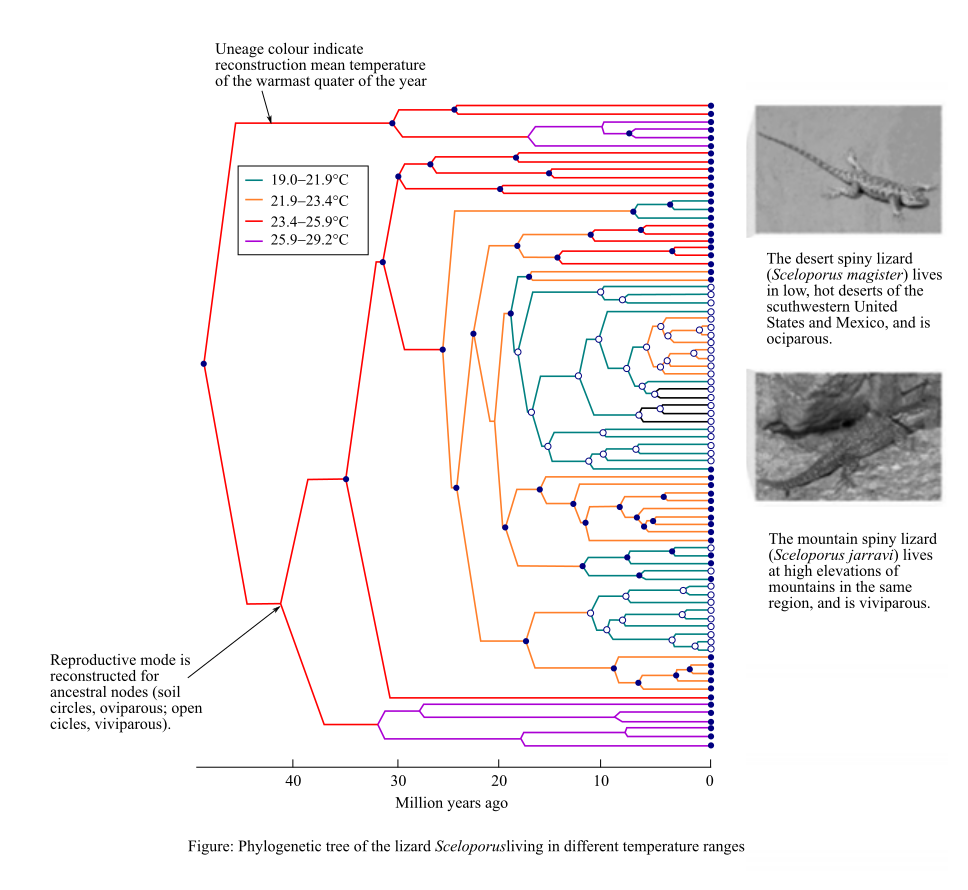
The evolution of viviparity in different lineages of the lizard Sceloporus living in different temperature ranges is shown in Figure 1 of the phylogenetic tree given below:
Introduction:
Animals like birds, reptiles, and amphibians in which the development of the young ones takes place inside the eggs laid by the female are known as oviparous animals. In viviparous animals like mammals, the development of the young ones takes place inside the body of the female who gives birth to the offspring.
Explanation of Solution
It can be observed from the given phylogenetic tree that viviparous mode of reproduction has evolved in the lineages which live in the 19.0–23.4°C temperature range during the warmest months (cool temperature areas).
According to the ‘cold-climate’ hypothesis, animals living in colder climates are more likely to evolve viviparity. In viviparous animals, the development of the young one takes place inside the body of the female and the parent invests more in the development of its offspring.
In areas with a cold climate (high altitudes), the female basks in the sun during the day and move to safe and warm places to take cover during the night. The female can thus regulate the temperature of its body by behavioral thermoregulation. This provides an ambient temperature for the growth and development of the embryo.
An increased parental investment leads to the birth of a few large-sized offspring, which are more capable of surviving to maturity, especially under adverse environmental conditions.
Therefore, it can be concluded that the lizards living in cold areas evolved viviparity because it helped in the better survival of the offspring till maturity.
Want to see more full solutions like this?
Chapter 32 Solutions
Life: The Science of Biology


- Describe and give a specific example of how successionary stage is related to species diversity?arrow_forwardExplain down bellow what happens to the cell in pictures not in words: Decreased pH in mitochondria Increased ATP Decreased pH in cytosol Increased hydrolysis Decreasing glycogen and triglycerides Increased MAP kinase activity Poor ion transport → For each one:→ What normally happens?→ What is wrong now?→ How does it mess up the cell?arrow_forward1.) Community Diversity: The brown and orange line represent two different plant communities. a. Which color represents the community with a higher species richness? b. Which color represents the community with a higher species evenness? Relative abundance 0.1 0.04 0.001 2 4 6 8 10 12 14 16 18 20 22 24 Rank abundance c. What is the maximum value of the Simpson's diversity index (remember, Simpson's index is D = p², Simpson's diversity index is 1-D)? d. If the Simpson's diversity index equals 1, what does that mean about the number of species and their relative abundance within community being assessed?arrow_forward
- 1.) Community Diversity: The brown and orange line represent two different plant communities. a. Which color represents the community with a higher species richness? b. Which color represents the community with a higher species evenness? Relative abundance 0.1 0.04 0.001 2 4 6 8 10 12 14 16 18 20 22 24 Rank abundance c. What is the maximum value of the Simpson's diversity index (remember, Simpson's index is D = p², Simpson's diversity index is 1-D)? d. If the Simpson's diversity index equals 1, what does that mean about the number of species and their relative abundance within community being assessed?arrow_forwardwhat measures can a mother to take to improve the produce of her to milk to her newborn baby ?arrow_forward1. Color the line that represents all ancestors of the Eastern white pine tree green (but only the ancestral line NOT shared with other organisms) 2. Oncle the last common ancestor of the Colorado blue spruce tree and Eastern white pine tree. 3. Put a box around the last common ancestor of the sugar maple tree and the dogwood tree. 4. Put a triangle around the last common ancestor of the red pine tree and the american holly bush. 5. Color the line that represents all ancestors of the Ponderosa pine tree red (including all shared ancestors). 6. Color the line that represents all ancestors of the American elm tree blue (including all shared ancestors). 7 Color the line that represents all ancestors of the Sabal palm tree purple (including all shared ancestors) 8. Using a yellow highlighter or colored pencil, circle the clade that includes all pine trees. 9. Using a orange highlighter or colored pencil, circle the clade that includes all gymnosperms 10. Can you tell…arrow_forward
- You have been hired as a public relations specialist to give invertebrates a good name. After all, they are much more than just creepy crawly bugs! Your first task though is to convince yourself that is true. The best way to do that is to start close to home. Find something in your house that is a product obtained directly from an invertebrate or only due to an invertebrate’s actions. Describe the product, its function and utility, as well as any human manufactured alternatives. Be sure to highlight the advantages of obtaining this directly from nature. Keep in mind, a product can be something you use, wear, eat, or enjoy for its visual appeal.arrow_forwardUse the following tree diagram to answer Questions #8-10. 8) Which of the following two animals are the most closely related based on the tree to the left? a) Pig and camel b) Hippo and pig c) Deer and cow 9) CIRCLE on the tree diagram where the common ancestor between a hippo and a cow is. 10) Put a SQUARE on the tree diagram where the common ancestor between a pig and a peccary is.arrow_forwardExplain: Healthy Cell Function Overview→ Briefly describe how a healthy cell usually works: metabolism (ATP production), pH balance, glycogen storage, ion transport, enzymes, etc. Gene Mutation and Genetics Part→ Focus on the autosomal recessive mutation and explain: How gene mutation affects the cell. How autosomal inheritance works. Compare the normal and mutated gene sequences simply. → Talk about possible consequences of a faulty hydrolytic enzyme.arrow_forward
- Can you fill out those termsarrow_forwardExplain down bellow what happens to the cell: Decreased pH in mitochondria Increased ATP Decreased pH in cytosol Increased hydrolysis Decreasing glycogen and triglycerides Increased MAP kinase activity Poor ion transport → For each one:→ What normally happens?→ What is wrong now?→ How does it mess up the cell?arrow_forwardAn 1100 pound equine patient was given 20 mg/kg sucralfate 3 times a day, 2.8 mg/kg famotidine twice a day, and 10mg/kg doxycycline twice a day. Sucralfate comes as a 1 gm tablet, famotidine as 20 mg tablets, and doxycycline as 100mg tablets. All are in bottles of 100 tablets.How many total mg are needed for the patient and how many tablets of each would be needed to provide each dose?How many bottles of each would be needed to have available if this patient were to be on this drug regimen for 5 days?arrow_forward
 Biology (MindTap Course List)BiologyISBN:9781337392938Author:Eldra Solomon, Charles Martin, Diana W. Martin, Linda R. BergPublisher:Cengage Learning
 Concepts of BiologyBiologyISBN:9781938168116Author:Samantha Fowler, Rebecca Roush, James WisePublisher:OpenStax College
 Biology 2eBiologyISBN:9781947172517Author:Matthew Douglas, Jung Choi, Mary Ann ClarkPublisher:OpenStax
 Biology: The Dynamic Science (MindTap Course List)BiologyISBN:9781305389892Author:Peter J. Russell, Paul E. Hertz, Beverly McMillanPublisher:Cengage Learning
 Biology Today and Tomorrow without Physiology (Mi...BiologyISBN:9781305117396Author:Cecie Starr, Christine Evers, Lisa StarrPublisher:Cengage Learning