
Fundamentals of Statistics Plus MyLab Statistics with Pearson eText - Title-Specific Access Card Package (5th Edition)
5th Edition
ISBN: 9780134763729
Author: Michael Sullivan III
Publisher: PEARSON
expand_more
expand_more
format_list_bulleted
Concept explainers
Videos
Textbook Question
Chapter 3.2, Problem 18AYU
pH in Water The acidity or alkalinity of a solution is measured using pH. A pH less than 7 is acidic, while a pH greater than 7 is alkaline. The following data represent the pH in samples of bottled water and tap water.
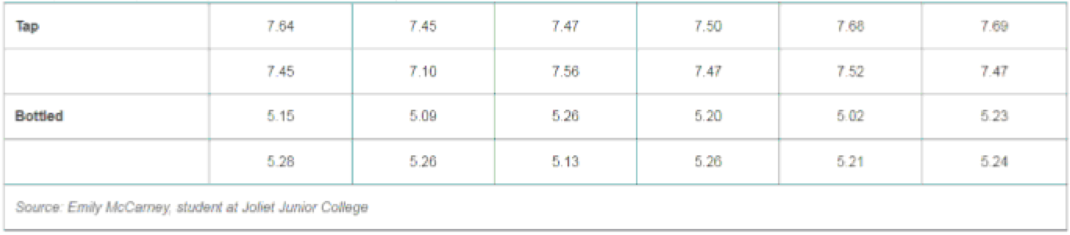
- a. Which type of water has more dispersion in pH using the
range as the measure of dispersion? - b. Which type of water has more dispersion in pH using the standard deviation as the measure of dispersion?
Expert Solution & Answer
Want to see the full answer?
Check out a sample textbook solution
Students have asked these similar questions
Business
https://www.hawkeslearning.com/Statistics/dbs2/datasets.html
NC Current Students - North Ce X | NC Canvas Login Links - North ( X
Final Exam Comprehensive x Cengage Learning
x
WASTAT - Final Exam - STAT
→
C
webassign.net/web/Student/Assignment-Responses/submit?dep=36055360&tags=autosave#question3659890_9
Part (b)
Draw a scatter plot of the ordered pairs.
N
Life
Expectancy
Life
Expectancy
80
70
600
50
40
30
20
10
Year of
1950
1970 1990
2010 Birth
O
Life
Expectancy
Part (c)
800
70
60
50
40
30
20
10
1950
1970 1990
W
ALT
林
$
#
4
R
J7
Year of
2010 Birth
F6
4+
80
70
60
50
40
30
20
10
Year of
1950 1970 1990
2010 Birth
Life
Expectancy
Ox
800
70
60
50
40
30
20
10
Year of
1950 1970 1990 2010 Birth
hp
P.B.
KA
&
7
80
% 5
H
A
B
F10
711
N
M
K
744
PRT SC
ALT
CTRL
Chapter 3 Solutions
Fundamentals of Statistics Plus MyLab Statistics with Pearson eText - Title-Specific Access Card Package (5th Edition)
Ch. 3.1 - What does it mean if a statistic is resistant?Ch. 3.1 - In the 2014 Current Population Survey conducted by...Ch. 3.1 - The U.S. Department of Housing and Urban...Ch. 3.1 - A histogram of a set of data indicates that the...Ch. 3.1 - If a data set contains 10,000 values arranged in...Ch. 3.1 - True or False: A data set will always have exactly...Ch. 3.1 - In Problems 710, find the population mean or...Ch. 3.1 - In Problems 710, find the population mean or...Ch. 3.1 - In Problems 710, find the population mean or...Ch. 3.1 - In Problems 710, find the population mean or...
Ch. 3.1 - For Super Bowl XLVII, there were 82,566 tickets...Ch. 3.1 - The median for the given set of six ordered data...Ch. 3.1 - Miles per Gallon The following data represent the...Ch. 3.1 - Exam Time The following data represent the amount...Ch. 3.1 - NW Concrete Mix A certain type of concrete mix is...Ch. 3.1 - Flight Time The following data represent the...Ch. 3.1 - For each of the three histograms shown, determine...Ch. 3.1 - Match the histograms shown to the summary...Ch. 3.1 - Exam Scores The data in the next column represent...Ch. 3.1 - pH in Water The acidity or alkalinity of a...Ch. 3.1 - NW Pulse Rates The following data represent the...Ch. 3.1 - Travel Time The data represent the travel time (in...Ch. 3.1 - NW Connection Time A histogram of the connection...Ch. 3.1 - Journal Costs A histogram of the annual...Ch. 3.1 - MMs The following data represent the weights (in...Ch. 3.1 - Old Faithful We have all heard of the Old Faithful...Ch. 3.1 - Hours Working A random sample of 25 college...Ch. 3.1 - Prob. 28AYUCh. 3.1 - NW Political Views A sample of 30 registered...Ch. 3.1 - Prob. 30AYUCh. 3.1 - Prob. 31AYUCh. 3.1 - Mr. Zuro finds the mean height of all 14 students...Ch. 3.1 - Missing Exam Grade A professor has recorded exam...Ch. 3.1 - Prob. 34AYUCh. 3.1 - Blood Alcohol Concentration Go to...Ch. 3.1 - Prob. 36AYUCh. 3.1 - Linear Transformations Benjamin owns a small...Ch. 3.1 - Linear Transformations Use the five test scores of...Ch. 3.1 - Trimmed Mean Another measure of central tendency...Ch. 3.1 - Prob. 40AYUCh. 3.1 - Putting It Together: Shape, Mean and Median As...Ch. 3.1 - FICO Scores The Fair Isaacs Corporation has...Ch. 3.1 - Why is the median resistant, but the mean is not?Ch. 3.1 - Prob. 44AYUCh. 3.1 - Net Worth According to a Credit Suisse Survey, the...Ch. 3.1 - Prob. 46AYUCh. 3.1 - In January 2016, the mean amount of money lost per...Ch. 3.1 - For each of the following situations, determine...Ch. 3.2 - The sum of the deviations about the mean always...Ch. 3.2 - The standard deviation is used in conjunction with...Ch. 3.2 - True or False: When comparing two populations, the...Ch. 3.2 - True or False: Chebyshevs Inequality applies to...Ch. 3.2 - In Problems 510, by hand, find the population...Ch. 3.2 - In Problems 510, by hand, find the population...Ch. 3.2 - In Problems 510, by hand, find the population...Ch. 3.2 - In Problems 510, by hand, find the population...Ch. 3.2 - In Problems 510, by hand, find the population...Ch. 3.2 - In Problems 510, by hand, find the population...Ch. 3.2 - Miles per Gallon The following data represent the...Ch. 3.2 - Exam Time The following data represent the amount...Ch. 3.2 - NW Concrete Mix A certain type of concrete mix is...Ch. 3.2 - Flight Time The following data represent the...Ch. 3.2 - Which histogram depicts a higher standard...Ch. 3.2 - Match the histograms in the next column to the...Ch. 3.2 - Exam Scores The following data represent exam...Ch. 3.2 - pH in Water The acidity or alkalinity of a...Ch. 3.2 - NW Pulse Rates The data on the following page...Ch. 3.2 - Travel Time The following data represent the...Ch. 3.2 - A Fish Story Ethan and Drew went on a 10-day...Ch. 3.2 - Prob. 22AYUCh. 3.2 - The Empirical Rule The following data represent...Ch. 3.2 - The Empirical Rule The following data represent...Ch. 3.2 - Prob. 25AYUCh. 3.2 - Prob. 26AYUCh. 3.2 - Prob. 27AYUCh. 3.2 - Temperatures It is well known that San Diego has...Ch. 3.2 - NW The Empirical Rule The StanfordBinet...Ch. 3.2 - The Empirical Rule SAT Math scores have a...Ch. 3.2 - The Empirical Rule The weight, in grams, of the...Ch. 3.2 - The Empirical Rule The distribution of the length...Ch. 3.2 - Which Professor Suppose Professor Alpha and...Ch. 3.2 - Larry Summers Lawrence Summers (former Secretary...Ch. 3.2 - NW Chebyshevs Inequality In December 2014, the...Ch. 3.2 - Chebyshevs Inequality According to the U.S. Census...Ch. 3.2 - Prob. 37AYUCh. 3.2 - Linear Transformations Benjamin owns a small...Ch. 3.2 - Prob. 39AYUCh. 3.2 - Prob. 40AYUCh. 3.2 - Prob. 41AYUCh. 3.2 - Blocking and Variability Blocking refers to the...Ch. 3.2 - Prob. 43AYUCh. 3.2 - Prob. 44AYUCh. 3.2 - Prob. 45AYUCh. 3.2 - More Spread? The data set on the left represents...Ch. 3.2 - Prob. 47AYUCh. 3.2 - Prob. 48AYUCh. 3.2 - Prob. 49AYUCh. 3.2 - What is meant by the phrase degrees of freedom as...Ch. 3.2 - Prob. 51AYUCh. 3.2 - Prob. 52AYUCh. 3.2 - What makes the range less desirable than the...Ch. 3.2 - Prob. 54AYUCh. 3.2 - Prob. 55AYUCh. 3.2 - Prob. 56AYUCh. 3.2 - Prob. 57AYUCh. 3.2 - Prob. 59AYUCh. 3.3 - NW Savings Recently, a random sample of 2534 year...Ch. 3.3 - Square Footage of Housing The frequency...Ch. 3.3 - Household Winter Temperature Often, frequency...Ch. 3.3 - Living in Poverty (See Problem 3.) The following...Ch. 3.3 - Multiple Births The following data represent the...Ch. 3.3 - Birth Weight The following frequency distribution...Ch. 3.3 - Cigarette Tax Rates Use the frequency distribution...Ch. 3.3 - Dividend Yield Use the frequency distribution...Ch. 3.3 - NW Grade-Point Average Marissa has just completed...Ch. 3.3 - Computing Class Average In Marissas calculus...Ch. 3.3 - Mixed Chocolates Michael and Kevin want to buy...Ch. 3.3 - Nut Mix Michael and Kevin return to the candy...Ch. 3.3 - Population The data represent the male and female...Ch. 3.3 - Age of Mother The following data represent the age...Ch. 3.3 - Approximate the median of the frequency...Ch. 3.3 - Prob. 16AYUCh. 3.3 - Prob. 17AYUCh. 3.3 - Determine the modal class of the frequency...Ch. 3.4 - The _____ represents the number of standard...Ch. 3.4 - The _____ _____ of a data set is a value such that...Ch. 3.4 - _____ divide data sets into fourths.Ch. 3.4 - Prob. 4AYUCh. 3.4 - Prob. 5AYUCh. 3.4 - Prob. 6AYUCh. 3.4 - Men versus Women The average 20- to 29-year-old...Ch. 3.4 - Prob. 8AYUCh. 3.4 - ERA Champions In 2014, Clayton Kershaw of the Los...Ch. 3.4 - Batting Champions The highest batting average ever...Ch. 3.4 - Prob. 11AYUCh. 3.4 - Triathlon Roberto finishes a triathlon (750-meter...Ch. 3.4 - School Admissions A highly selective boarding...Ch. 3.4 - Quality Control A manufacturer of bolts has a...Ch. 3.4 - Prob. 15AYUCh. 3.4 - You Explain It! Percentiles Explain the meaning of...Ch. 3.4 - You Explain It! Quartiles Violent crimes include...Ch. 3.4 - You Explain It! Quartiles One variable that is...Ch. 3.4 - Ogives and Percentiles The following graph is an...Ch. 3.4 - Ogives and Percentiles The following graph is an...Ch. 3.4 - NW SMART Car The data on the following page...Ch. 3.4 - Hemoglobin in Cats The following data represent...Ch. 3.4 - Rate of Return of Google The following data...Ch. 3.4 - CO2 Emissions The following data represent the...Ch. 3.4 - Fraud Detection As part of its Customers First...Ch. 3.4 - Stolen Credit Card A credit card company has a...Ch. 3.4 - Student Survey of Income A survey of 50 randomly...Ch. 3.4 - Student Survey of Entertainment Spending A survey...Ch. 3.4 - Prob. 29AYUCh. 3.4 - Travel Time Use the results of Problem 22 in...Ch. 3.4 - Fraud Detection Revisited Use the fraud-detection...Ch. 3.4 - Write a paragraph that explains the meaning of...Ch. 3.4 - Suppose you received the highest score on an exam....Ch. 3.4 - Prob. 34AYUCh. 3.4 - Prob. 35AYUCh. 3.4 - Prob. 36AYUCh. 3.4 - Prob. 37AYUCh. 3.4 - Prob. 38AYUCh. 3.4 - Prob. 39AYUCh. 3.5 - What does the five-number summary consist of?Ch. 3.5 - In a boxplot, if the median is to the left of the...Ch. 3.5 - Prob. 3AYUCh. 3.5 - In Problems 3 and 4, (a) identify the shape of the...Ch. 3.5 - Use the side-by-side boxplots shown to answer the...Ch. 3.5 - Use the side-by-side boxplots shown to answer the...Ch. 3.5 - Exam Scores After giving a statistics exam,...Ch. 3.5 - Prob. 8AYUCh. 3.5 - Prob. 9AYUCh. 3.5 - Carpoolers The following data represent the...Ch. 3.5 - NW Age of Mother at Birth The data below represent...Ch. 3.5 - Prob. 12AYUCh. 3.5 - Prob. 13AYUCh. 3.5 - Prob. 14AYUCh. 3.5 - Prob. 15AYUCh. 3.5 - Prob. 16AYUCh. 3.5 - Putting It Together: Earthquakes Go to...Ch. 3.5 - Putting It Together: Paternal Smoking It is...Ch. 3.5 - Retain Your Knowledge: Decision Making and Hunger...Ch. 3.5 - Prob. 20AYUCh. 3.5 - Prob. 21AYUCh. 3 - Muzzle Velocity The following data represent the...Ch. 3 - Price of Chevy Cobalts The following data...Ch. 3 - Chief Justices The following data represent the...Ch. 3 - Number of Tickets Issued As part of a statistics...Ch. 3 - Chebyshevs Inequality and the Empirical Rule...Ch. 3 - Prob. 6RECh. 3 - Weighted Mean Michael has just completed his first...Ch. 3 - Weights of Males versus Females According to the...Ch. 3 - Halladay No-No On October 6, 2010, Roy Halladay of...Ch. 3 - Presidential Inaugural Addresses Ever wonder how...Ch. 3 - You Explain It! Percentiles According to the...Ch. 3 - Skinfold Thickness Procedure One method of...Ch. 3 - The following data represent the amount of time...Ch. 3 - The Federal Bureau of Investigation classifies...Ch. 3 - Determine the range of the homework data from...Ch. 3 - a. Determine the standard deviation of the...Ch. 3 - In a random sample of 250 toner cartridges, the...Ch. 3 - The following data represent the length of time...Ch. 3 - Prob. 7CTCh. 3 - An engineer is studying bearing failures for two...Ch. 3 - The following data represent the weights (in...Ch. 3 - Armando is filling out a college application that...Ch. 3 - According to the National Center for Health...Ch. 3 - Prob. 12CTCh. 3 - Answer the following based on the histograms shown...Ch. 3 - Explain how the standard deviation measures...Ch. 3 - Generate a data set consisting of the length of...Ch. 3 - Prob. 2CSCh. 3 - Prob. 3CS
Knowledge Booster


Learn more about
Need a deep-dive on the concept behind this application? Look no further. Learn more about this topic, statistics and related others by exploring similar questions and additional content below.Similar questions
- Harvard University California Institute of Technology Massachusetts Institute of Technology Stanford University Princeton University University of Cambridge University of Oxford University of California, Berkeley Imperial College London Yale University University of California, Los Angeles University of Chicago Johns Hopkins University Cornell University ETH Zurich University of Michigan University of Toronto Columbia University University of Pennsylvania Carnegie Mellon University University of Hong Kong University College London University of Washington Duke University Northwestern University University of Tokyo Georgia Institute of Technology Pohang University of Science and Technology University of California, Santa Barbara University of British Columbia University of North Carolina at Chapel Hill University of California, San Diego University of Illinois at Urbana-Champaign National University of Singapore McGill…arrow_forwardName Harvard University California Institute of Technology Massachusetts Institute of Technology Stanford University Princeton University University of Cambridge University of Oxford University of California, Berkeley Imperial College London Yale University University of California, Los Angeles University of Chicago Johns Hopkins University Cornell University ETH Zurich University of Michigan University of Toronto Columbia University University of Pennsylvania Carnegie Mellon University University of Hong Kong University College London University of Washington Duke University Northwestern University University of Tokyo Georgia Institute of Technology Pohang University of Science and Technology University of California, Santa Barbara University of British Columbia University of North Carolina at Chapel Hill University of California, San Diego University of Illinois at Urbana-Champaign National University of Singapore…arrow_forwardA company found that the daily sales revenue of its flagship product follows a normal distribution with a mean of $4500 and a standard deviation of $450. The company defines a "high-sales day" that is, any day with sales exceeding $4800. please provide a step by step on how to get the answers in excel Q: What percentage of days can the company expect to have "high-sales days" or sales greater than $4800? Q: What is the sales revenue threshold for the bottom 10% of days? (please note that 10% refers to the probability/area under bell curve towards the lower tail of bell curve) Provide answers in the yellow cellsarrow_forward
- Find the critical value for a left-tailed test using the F distribution with a 0.025, degrees of freedom in the numerator=12, and degrees of freedom in the denominator = 50. A portion of the table of critical values of the F-distribution is provided. Click the icon to view the partial table of critical values of the F-distribution. What is the critical value? (Round to two decimal places as needed.)arrow_forwardA retail store manager claims that the average daily sales of the store are $1,500. You aim to test whether the actual average daily sales differ significantly from this claimed value. You can provide your answer by inserting a text box and the answer must include: Null hypothesis, Alternative hypothesis, Show answer (output table/summary table), and Conclusion based on the P value. Showing the calculation is a must. If calculation is missing,so please provide a step by step on the answers Numerical answers in the yellow cellsarrow_forwardShow all workarrow_forward
arrow_back_ios
SEE MORE QUESTIONS
arrow_forward_ios
Recommended textbooks for you
 Big Ideas Math A Bridge To Success Algebra 1: Stu...AlgebraISBN:9781680331141Author:HOUGHTON MIFFLIN HARCOURTPublisher:Houghton Mifflin Harcourt
 Glencoe Algebra 1, Student Edition, 9780079039897...AlgebraISBN:9780079039897Author:CarterPublisher:McGraw Hill
 Holt Mcdougal Larson Pre-algebra: Student Edition...AlgebraISBN:9780547587776Author:HOLT MCDOUGALPublisher:HOLT MCDOUGAL
 Functions and Change: A Modeling Approach to Coll...AlgebraISBN:9781337111348Author:Bruce Crauder, Benny Evans, Alan NoellPublisher:Cengage Learning
 Algebra: Structure And Method, Book 1AlgebraISBN:9780395977224Author:Richard G. Brown, Mary P. Dolciani, Robert H. Sorgenfrey, William L. ColePublisher:McDougal Littell
Big Ideas Math A Bridge To Success Algebra 1: Stu...
Algebra
ISBN:9781680331141
Author:HOUGHTON MIFFLIN HARCOURT
Publisher:Houghton Mifflin Harcourt
Glencoe Algebra 1, Student Edition, 9780079039897...
Algebra
ISBN:9780079039897
Author:Carter
Publisher:McGraw Hill
Holt Mcdougal Larson Pre-algebra: Student Edition...
Algebra
ISBN:9780547587776
Author:HOLT MCDOUGAL
Publisher:HOLT MCDOUGAL
Functions and Change: A Modeling Approach to Coll...
Algebra
ISBN:9781337111348
Author:Bruce Crauder, Benny Evans, Alan Noell
Publisher:Cengage Learning
Algebra: Structure And Method, Book 1
Algebra
ISBN:9780395977224
Author:Richard G. Brown, Mary P. Dolciani, Robert H. Sorgenfrey, William L. Cole
Publisher:McDougal Littell
Continuous Probability Distributions - Basic Introduction; Author: The Organic Chemistry Tutor;https://www.youtube.com/watch?v=QxqxdQ_g2uw;License: Standard YouTube License, CC-BY
Probability Density Function (p.d.f.) Finding k (Part 1) | ExamSolutions; Author: ExamSolutions;https://www.youtube.com/watch?v=RsuS2ehsTDM;License: Standard YouTube License, CC-BY
Find the value of k so that the Function is a Probability Density Function; Author: The Math Sorcerer;https://www.youtube.com/watch?v=QqoCZWrVnbA;License: Standard Youtube License