
An Introduction to Statistical Methods and Data Analysis
7th Edition
ISBN: 9781305269477
Author: R. Lyman Ott, Micheal T. Longnecker
Publisher: Cengage Learning
expand_more
expand_more
format_list_bulleted
Videos
Textbook Question
Chapter 3.11, Problem 1E
The U.S. government spent more than $3.6 trillion in the 2014 fiscal year. The following table provides broad categories that demonstrate the expenditures of the federal government for domestic and defense programs.
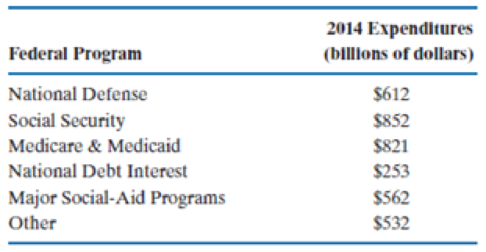
- a. Construct a pie chart for these data.
- b. Construct a bar chart for these data.
- c. Construct a pie chart and bar chart using percentages in place of dollars.
- d. Which of the four charts is more informative to the tax-paying public?
Expert Solution & Answer
Want to see the full answer?
Check out a sample textbook solution
Students have asked these similar questions
The managing director of a consulting group has the accompanying monthly data on total overhead costs and professional labor hours to bill to clients. Complete parts a through c
Overhead Costs Billable Hours345000 3000385000 4000410000 5000462000 6000530000 7000545000 8000
Using the accompanying Home Market Value data and associated regression line,
Market ValueMarket Valueequals=$28,416plus+$37.066×Square
Feet, compute the errors associated with each observation using the formula
e Subscript ieiequals=Upper Y Subscript iYiminus−ModifyingAbove Upper Y with caret Subscript iYi
and construct a frequency distribution and histogram.
Square Feet Market Value1813 911001916 1043001842 934001814 909001836 1020002030 1085001731 877001852 960001793 893001665 884001852 1009001619 967001690 876002370 1139002373 1131001666 875002122 1161001619 946001729 863001667 871001522 833001484 798001589 814001600 871001484 825001483 787001522 877001703 942001485 820001468 881001519 882001518 885001483 765001522 844001668 909001587 810001782 912001483 812001519 1007001522 872001684 966001581 86200
a. Find the value of A.b. Find pX(x) and py(y).c. Find pX|y(x|y) and py|X(y|x)d. Are x and y independent? Why or why not?
Chapter 3 Solutions
An Introduction to Statistical Methods and Data Analysis
Ch. 3.11 - The U.S. government spent more than $3.6 trillion...Ch. 3.11 - The type of vehicle the U.S public purchases...Ch. 3.11 - It has been reported that there has been a change...Ch. 3.11 - The regulations of the board of health in a...Ch. 3.11 - The National Highway Traffic Safety Administration...Ch. 3.11 - Prob. 6ECh. 3.11 - The survival times (in months) for two treatments...Ch. 3.11 - Combine the data from the separate therapies in...Ch. 3.11 - Prob. 9ECh. 3.11 - The following table presents homeownership rates,...
Ch. 3.11 - Prob. 11ECh. 3.11 - Prob. 12ECh. 3.11 - A supplier of high-quality audio equipment for...Ch. 3.11 - Prob. 14ECh. 3.11 - Compute the mean, median, and mode for the...Ch. 3.11 - Prob. 16ECh. 3.11 - Prob. 17ECh. 3.11 - Prob. 18ECh. 3.11 - A study of the reliability of buses [Large Sample...Ch. 3.11 - Prob. 20ECh. 3.11 - Prob. 21ECh. 3.11 - A study of the survival times, in days, of skin...Ch. 3.11 - Prob. 23ECh. 3.11 - Prob. 24ECh. 3.11 -
Refer to Exercise 3.24. Average the three group...Ch. 3.11 -
Pushing economy and wheelchair-propulsion...Ch. 3.11 - Prob. 27ECh. 3.11 - Prob. 28ECh. 3.11 -
The treatment times (in minutes) for patients at...Ch. 3.11 - To assist in estimating the amount of lumber in a...Ch. 3.11 -
Consumer Reports in its June 1998 issue reports...Ch. 3.11 - Many marine phanerogam species are highly...Ch. 3.11 - Prob. 33ECh. 3.11 - The following data are the resting pulse rates for...Ch. 3.11 - Consumer Reports in its May 1998 issue provides...Ch. 3.11 - Prob. 36ECh. 3.11 - Prob. 37ECh. 3.11 - Prob. 38ECh. 3.11 - In the paper “Demographic Implications of...Ch. 3.11 - Prob. 40ECh. 3.11 - Prob. 41ECh. 3.11 - Prob. 42ECh. 3.11 - Prob. 43SECh. 3.11 - Prob. 44SECh. 3.11 - Prob. 45SECh. 3.11 - Prob. 46SECh. 3.11 - Prob. 47SECh. 3.11 - Prob. 48SECh. 3.11 - A random sample of 90 standard metropolitan...Ch. 3.11 - Prob. 50SECh. 3.11 - Prob. 51SECh. 3.11 - Prob. 52SECh. 3.11 - Prob. 53SECh. 3.11 - The Insurance Institute for Highway Safety...Ch. 3.11 - Prob. 55SECh. 3.11 - Prob. 56SECh. 3.11 -
Federal authorities have destroyed considerable...Ch. 3.11 - The most widely reported index of the performance...Ch. 3.11 - As one part of a review of middle-manager...Ch. 3.11 - Prob. 60SECh. 3.11 - Prob. 61SECh. 3.11 - Prob. 62SECh. 3.11 - The correlations computed for the six variables in...Ch. 3.11 - Prob. 64SECh. 3.11 - Prob. 65SECh. 3.11 - Prob. 66SECh. 3.11 - Prob. 67SECh. 3.11 - Prob. 68SECh. 3.11 - Prob. 69SECh. 3.11 - Prob. 70SECh. 3.11 - Prob. 71SECh. 3.11 -
Refer to the data in Exercise 3.69.
Construct a...Ch. 3.11 - Prob. 73SECh. 3.11 - Prob. 74SECh. 3.11 - Prob. 75SECh. 3.11 - Prob. 76SECh. 3.11 - Prob. 77SECh. 3.11 - Prob. 78SECh. 3.11 - Prob. 79SECh. 3.11 - Prob. 80SE
Knowledge Booster


Learn more about
Need a deep-dive on the concept behind this application? Look no further. Learn more about this topic, statistics and related others by exploring similar questions and additional content below.Similar questions
- The PDF of an amplitude X of a Gaussian signal x(t) is given by:arrow_forwardThe PDF of a random variable X is given by the equation in the picture.arrow_forwardFor a binary asymmetric channel with Py|X(0|1) = 0.1 and Py|X(1|0) = 0.2; PX(0) = 0.4 isthe probability of a bit of “0” being transmitted. X is the transmitted digit, and Y is the received digit.a. Find the values of Py(0) and Py(1).b. What is the probability that only 0s will be received for a sequence of 10 digits transmitted?c. What is the probability that 8 1s and 2 0s will be received for the same sequence of 10 digits?d. What is the probability that at least 5 0s will be received for the same sequence of 10 digits?arrow_forward
- V2 360 Step down + I₁ = I2 10KVA 120V 10KVA 1₂ = 360-120 or 2nd Ratio's V₂ m 120 Ratio= 360 √2 H I2 I, + I2 120arrow_forwardQ2. [20 points] An amplitude X of a Gaussian signal x(t) has a mean value of 2 and an RMS value of √(10), i.e. square root of 10. Determine the PDF of x(t).arrow_forwardIn a network with 12 links, one of the links has failed. The failed link is randomlylocated. An electrical engineer tests the links one by one until the failed link is found.a. What is the probability that the engineer will find the failed link in the first test?b. What is the probability that the engineer will find the failed link in five tests?Note: You should assume that for Part b, the five tests are done consecutively.arrow_forward
- Problem 3. Pricing a multi-stock option the Margrabe formula The purpose of this problem is to price a swap option in a 2-stock model, similarly as what we did in the example in the lectures. We consider a two-dimensional Brownian motion given by W₁ = (W(¹), W(2)) on a probability space (Q, F,P). Two stock prices are modeled by the following equations: dX = dY₁ = X₁ (rdt+ rdt+0₁dW!) (²)), Y₁ (rdt+dW+0zdW!"), with Xo xo and Yo =yo. This corresponds to the multi-stock model studied in class, but with notation (X+, Y₁) instead of (S(1), S(2)). Given the model above, the measure P is already the risk-neutral measure (Both stocks have rate of return r). We write σ = 0₁+0%. We consider a swap option, which gives you the right, at time T, to exchange one share of X for one share of Y. That is, the option has payoff F=(Yr-XT). (a) We first assume that r = 0 (for questions (a)-(f)). Write an explicit expression for the process Xt. Reminder before proceeding to question (b): Girsanov's theorem…arrow_forwardProblem 1. Multi-stock model We consider a 2-stock model similar to the one studied in class. Namely, we consider = S(1) S(2) = S(¹) exp (σ1B(1) + (M1 - 0/1 ) S(²) exp (02B(2) + (H₂- M2 where (B(¹) ) +20 and (B(2) ) +≥o are two Brownian motions, with t≥0 Cov (B(¹), B(2)) = p min{t, s}. " The purpose of this problem is to prove that there indeed exists a 2-dimensional Brownian motion (W+)+20 (W(1), W(2))+20 such that = S(1) S(2) = = S(¹) exp (011W(¹) + (μ₁ - 01/1) t) 롱) S(²) exp (021W (1) + 022W(2) + (112 - 03/01/12) t). where σ11, 21, 22 are constants to be determined (as functions of σ1, σ2, p). Hint: The constants will follow the formulas developed in the lectures. (a) To show existence of (Ŵ+), first write the expression for both W. (¹) and W (2) functions of (B(1), B(²)). as (b) Using the formulas obtained in (a), show that the process (WA) is actually a 2- dimensional standard Brownian motion (i.e. show that each component is normal, with mean 0, variance t, and that their…arrow_forwardThe scores of 8 students on the midterm exam and final exam were as follows. Student Midterm Final Anderson 98 89 Bailey 88 74 Cruz 87 97 DeSana 85 79 Erickson 85 94 Francis 83 71 Gray 74 98 Harris 70 91 Find the value of the (Spearman's) rank correlation coefficient test statistic that would be used to test the claim of no correlation between midterm score and final exam score. Round your answer to 3 places after the decimal point, if necessary. Test statistic: rs =arrow_forward
- Business discussarrow_forwardBusiness discussarrow_forwardI just need to know why this is wrong below: What is the test statistic W? W=5 (incorrect) and What is the p-value of this test? (p-value < 0.001-- incorrect) Use the Wilcoxon signed rank test to test the hypothesis that the median number of pages in the statistics books in the library from which the sample was taken is 400. A sample of 12 statistics books have the following numbers of pages pages 127 217 486 132 397 297 396 327 292 256 358 272 What is the sum of the negative ranks (W-)? 75 What is the sum of the positive ranks (W+)? 5What type of test is this? two tailedWhat is the test statistic W? 5 These are the critical values for a 1-tailed Wilcoxon Signed Rank test for n=12 Alpha Level 0.001 0.005 0.01 0.025 0.05 0.1 0.2 Critical Value 75 70 68 64 60 56 50 What is the p-value for this test? p-value < 0.001arrow_forward
arrow_back_ios
SEE MORE QUESTIONS
arrow_forward_ios
Recommended textbooks for you
 Holt Mcdougal Larson Pre-algebra: Student Edition...AlgebraISBN:9780547587776Author:HOLT MCDOUGALPublisher:HOLT MCDOUGAL
 Glencoe Algebra 1, Student Edition, 9780079039897...AlgebraISBN:9780079039897Author:CarterPublisher:McGraw Hill
Holt Mcdougal Larson Pre-algebra: Student Edition...
Algebra
ISBN:9780547587776
Author:HOLT MCDOUGAL
Publisher:HOLT MCDOUGAL
Glencoe Algebra 1, Student Edition, 9780079039897...
Algebra
ISBN:9780079039897
Author:Carter
Publisher:McGraw Hill
How to make Frequency Distribution Table / Tally Marks and Frequency Distribution Table; Author: Reenu Math;https://www.youtube.com/watch?v=i_A6RiE8tLE;License: Standard YouTube License, CC-BY
Frequency distribution table in statistics; Author: Math and Science;https://www.youtube.com/watch?v=T7KYO76DoOE;License: Standard YouTube License, CC-BY
Frequency Distribution Table for Grouped/Continuous data | Math Dot Com; Author: Maths dotcom;https://www.youtube.com/watch?v=ErnccbXQOPY;License: Standard Youtube License