
An Introduction to Statistical Methods and Data Analysis
7th Edition
ISBN: 9781305269477
Author: R. Lyman Ott, Micheal T. Longnecker
Publisher: Cengage Learning
expand_more
expand_more
format_list_bulleted
Concept explainers
Videos
Textbook Question
Chapter 3.11, Problem 8E
Combine the data from the separate therapies in Exercise 3.7 into a single data set, and construct a relative frequency histogram for this combined data set. Does the plot indicate that the data are from two separate populations? Explain your answer.
The survival times (in months) for two treatments for patients with severe chronic left-ventricular heart failure are given in the following tables.
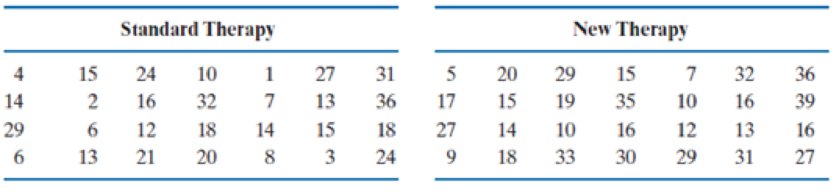
- a. Construct separate relative frequency histograms for the survival times of both the therapies.
- b. Compare the two histograms. Does the new therapy appear to generate a longer survival time? Explain your answer.
Expert Solution & Answer
Want to see the full answer?
Check out a sample textbook solution
Students have asked these similar questions
What would you say about a set of quantitative bivariate data whose linear correlation is -1? What would a scatter diagram of the data look like? (5 points)
Business discuss
Analyze the residuals of a linear regression model and select the best response.
yes, the residual plot does not show a curve
no, the residual plot shows a curve
yes, the residual plot shows a curve
no, the residual plot does not show a curve
I answered, "No, the residual plot shows a curve." (and this was incorrect). I am not sure why I keep getting these wrong when the answer seems obvious. Please help me understand what the yes and no references in the answer.
Chapter 3 Solutions
An Introduction to Statistical Methods and Data Analysis
Ch. 3.11 - The U.S. government spent more than $3.6 trillion...Ch. 3.11 - The type of vehicle the U.S public purchases...Ch. 3.11 - It has been reported that there has been a change...Ch. 3.11 - The regulations of the board of health in a...Ch. 3.11 - The National Highway Traffic Safety Administration...Ch. 3.11 - Prob. 6ECh. 3.11 - The survival times (in months) for two treatments...Ch. 3.11 - Combine the data from the separate therapies in...Ch. 3.11 - Prob. 9ECh. 3.11 - The following table presents homeownership rates,...
Ch. 3.11 - Prob. 11ECh. 3.11 - Prob. 12ECh. 3.11 - A supplier of high-quality audio equipment for...Ch. 3.11 - Prob. 14ECh. 3.11 - Compute the mean, median, and mode for the...Ch. 3.11 - Prob. 16ECh. 3.11 - Prob. 17ECh. 3.11 - Prob. 18ECh. 3.11 - A study of the reliability of buses [Large Sample...Ch. 3.11 - Prob. 20ECh. 3.11 - Prob. 21ECh. 3.11 - A study of the survival times, in days, of skin...Ch. 3.11 - Prob. 23ECh. 3.11 - Prob. 24ECh. 3.11 -
Refer to Exercise 3.24. Average the three group...Ch. 3.11 -
Pushing economy and wheelchair-propulsion...Ch. 3.11 - Prob. 27ECh. 3.11 - Prob. 28ECh. 3.11 -
The treatment times (in minutes) for patients at...Ch. 3.11 - To assist in estimating the amount of lumber in a...Ch. 3.11 -
Consumer Reports in its June 1998 issue reports...Ch. 3.11 - Many marine phanerogam species are highly...Ch. 3.11 - Prob. 33ECh. 3.11 - The following data are the resting pulse rates for...Ch. 3.11 - Consumer Reports in its May 1998 issue provides...Ch. 3.11 - Prob. 36ECh. 3.11 - Prob. 37ECh. 3.11 - Prob. 38ECh. 3.11 - In the paper “Demographic Implications of...Ch. 3.11 - Prob. 40ECh. 3.11 - Prob. 41ECh. 3.11 - Prob. 42ECh. 3.11 - Prob. 43SECh. 3.11 - Prob. 44SECh. 3.11 - Prob. 45SECh. 3.11 - Prob. 46SECh. 3.11 - Prob. 47SECh. 3.11 - Prob. 48SECh. 3.11 - A random sample of 90 standard metropolitan...Ch. 3.11 - Prob. 50SECh. 3.11 - Prob. 51SECh. 3.11 - Prob. 52SECh. 3.11 - Prob. 53SECh. 3.11 - The Insurance Institute for Highway Safety...Ch. 3.11 - Prob. 55SECh. 3.11 - Prob. 56SECh. 3.11 -
Federal authorities have destroyed considerable...Ch. 3.11 - The most widely reported index of the performance...Ch. 3.11 - As one part of a review of middle-manager...Ch. 3.11 - Prob. 60SECh. 3.11 - Prob. 61SECh. 3.11 - Prob. 62SECh. 3.11 - The correlations computed for the six variables in...Ch. 3.11 - Prob. 64SECh. 3.11 - Prob. 65SECh. 3.11 - Prob. 66SECh. 3.11 - Prob. 67SECh. 3.11 - Prob. 68SECh. 3.11 - Prob. 69SECh. 3.11 - Prob. 70SECh. 3.11 - Prob. 71SECh. 3.11 -
Refer to the data in Exercise 3.69.
Construct a...Ch. 3.11 - Prob. 73SECh. 3.11 - Prob. 74SECh. 3.11 - Prob. 75SECh. 3.11 - Prob. 76SECh. 3.11 - Prob. 77SECh. 3.11 - Prob. 78SECh. 3.11 - Prob. 79SECh. 3.11 - Prob. 80SE
Knowledge Booster


Learn more about
Need a deep-dive on the concept behind this application? Look no further. Learn more about this topic, statistics and related others by exploring similar questions and additional content below.Similar questions
- a. Find the value of A.b. Find pX(x) and py(y).c. Find pX|y(x|y) and py|X(y|x)d. Are x and y independent? Why or why not?arrow_forwardAnalyze the residuals of a linear regression model and select the best response.Criteria is simple evaluation of possible indications of an exponential model vs. linear model) no, the residual plot does not show a curve yes, the residual plot does not show a curve yes, the residual plot shows a curve no, the residual plot shows a curve I selected: yes, the residual plot shows a curve and it is INCORRECT. Can u help me understand why?arrow_forwardYou have been hired as an intern to run analyses on the data and report the results back to Sarah; the five questions that Sarah needs you to address are given below. please do it step by step on excel Does there appear to be a positive or negative relationship between price and screen size? Use a scatter plot to examine the relationship. Determine and interpret the correlation coefficient between the two variables. In your interpretation, discuss the direction of the relationship (positive, negative, or zero relationship). Also discuss the strength of the relationship. Estimate the relationship between screen size and price using a simple linear regression model and interpret the estimated coefficients. (In your interpretation, tell the dollar amount by which price will change for each unit of increase in screen size). Include the manufacturer dummy variable (Samsung=1, 0 otherwise) and estimate the relationship between screen size, price and manufacturer dummy as a multiple…arrow_forward
- Here is data with as the response variable. x y54.4 19.124.9 99.334.5 9.476.6 0.359.4 4.554.4 0.139.2 56.354 15.773.8 9-156.1 319.2Make a scatter plot of this data. Which point is an outlier? Enter as an ordered pair, e.g., (x,y). (x,y)= Find the regression equation for the data set without the outlier. Enter the equation of the form mx+b rounded to three decimal places. y_wo= Find the regression equation for the data set with the outlier. Enter the equation of the form mx+b rounded to three decimal places. y_w=arrow_forwardYou have been hired as an intern to run analyses on the data and report the results back to Sarah; the five questions that Sarah needs you to address are given below. please do it step by step Does there appear to be a positive or negative relationship between price and screen size? Use a scatter plot to examine the relationship. Determine and interpret the correlation coefficient between the two variables. In your interpretation, discuss the direction of the relationship (positive, negative, or zero relationship). Also discuss the strength of the relationship. Estimate the relationship between screen size and price using a simple linear regression model and interpret the estimated coefficients. (In your interpretation, tell the dollar amount by which price will change for each unit of increase in screen size). Include the manufacturer dummy variable (Samsung=1, 0 otherwise) and estimate the relationship between screen size, price and manufacturer dummy as a multiple linear…arrow_forwardExercises: Find all the whole number solutions of the congruence equation. 1. 3x 8 mod 11 2. 2x+3= 8 mod 12 3. 3x+12= 7 mod 10 4. 4x+6= 5 mod 8 5. 5x+3= 8 mod 12arrow_forward
- Scenario Sales of products by color follow a peculiar, but predictable, pattern that determines how many units will sell in any given year. This pattern is shown below Product Color 1995 1996 1997 Red 28 42 21 1998 23 1999 29 2000 2001 2002 Unit Sales 2003 2004 15 8 4 2 1 2005 2006 discontinued Green 26 39 20 22 28 14 7 4 2 White 43 65 33 36 45 23 12 Brown 58 87 44 48 60 Yellow 37 56 28 31 Black 28 42 21 Orange 19 29 Purple Total 28 42 21 49 68 78 95 123 176 181 164 127 24 179 Questions A) Which color will sell the most units in 2007? B) Which color will sell the most units combined in the 2007 to 2009 period? Please show all your analysis, leave formulas in cells, and specify any assumptions you make.arrow_forwardOne hundred students were surveyed about their preference between dogs and cats. The following two-way table displays data for the sample of students who responded to the survey. Preference Male Female TOTAL Prefers dogs \[36\] \[20\] \[56\] Prefers cats \[10\] \[26\] \[36\] No preference \[2\] \[6\] \[8\] TOTAL \[48\] \[52\] \[100\] problem 1 Find the probability that a randomly selected student prefers dogs.Enter your answer as a fraction or decimal. \[P\left(\text{prefers dogs}\right)=\] Incorrect Check Hide explanation Preference Male Female TOTAL Prefers dogs \[\blueD{36}\] \[\blueD{20}\] \[\blueE{56}\] Prefers cats \[10\] \[26\] \[36\] No preference \[2\] \[6\] \[8\] TOTAL \[48\] \[52\] \[100\] There were \[\blueE{56}\] students in the sample who preferred dogs out of \[100\] total students.arrow_forwardBusiness discussarrow_forward
- You have been hired as an intern to run analyses on the data and report the results back to Sarah; the five questions that Sarah needs you to address are given below. Does there appear to be a positive or negative relationship between price and screen size? Use a scatter plot to examine the relationship. Determine and interpret the correlation coefficient between the two variables. In your interpretation, discuss the direction of the relationship (positive, negative, or zero relationship). Also discuss the strength of the relationship. Estimate the relationship between screen size and price using a simple linear regression model and interpret the estimated coefficients. (In your interpretation, tell the dollar amount by which price will change for each unit of increase in screen size). Include the manufacturer dummy variable (Samsung=1, 0 otherwise) and estimate the relationship between screen size, price and manufacturer dummy as a multiple linear regression model. Interpret the…arrow_forwardDoes there appear to be a positive or negative relationship between price and screen size? Use a scatter plot to examine the relationship. How to take snapshots: if you use a MacBook, press Command+ Shift+4 to take snapshots. If you are using Windows, use the Snipping Tool to take snapshots. Question 1: Determine and interpret the correlation coefficient between the two variables. In your interpretation, discuss the direction of the relationship (positive, negative, or zero relationship). Also discuss the strength of the relationship. Value of correlation coefficient: Direction of the relationship (positive, negative, or zero relationship): Strength of the relationship (strong/moderate/weak): Question 2: Estimate the relationship between screen size and price using a simple linear regression model and interpret the estimated coefficients. In your interpretation, tell the dollar amount by which price will change for each unit of increase in screen size. (The answer for the…arrow_forwardIn this problem, we consider a Brownian motion (W+) t≥0. We consider a stock model (St)t>0 given (under the measure P) by d.St 0.03 St dt + 0.2 St dwt, with So 2. We assume that the interest rate is r = 0.06. The purpose of this problem is to price an option on this stock (which we name cubic put). This option is European-type, with maturity 3 months (i.e. T = 0.25 years), and payoff given by F = (8-5)+ (a) Write the Stochastic Differential Equation satisfied by (St) under the risk-neutral measure Q. (You don't need to prove it, simply give the answer.) (b) Give the price of a regular European put on (St) with maturity 3 months and strike K = 2. (c) Let X = S. Find the Stochastic Differential Equation satisfied by the process (Xt) under the measure Q. (d) Find an explicit expression for X₁ = S3 under measure Q. (e) Using the results above, find the price of the cubic put option mentioned above. (f) Is the price in (e) the same as in question (b)? (Explain why.)arrow_forward
arrow_back_ios
SEE MORE QUESTIONS
arrow_forward_ios
Recommended textbooks for you
 Glencoe Algebra 1, Student Edition, 9780079039897...AlgebraISBN:9780079039897Author:CarterPublisher:McGraw Hill
 Big Ideas Math A Bridge To Success Algebra 1: Stu...AlgebraISBN:9781680331141Author:HOUGHTON MIFFLIN HARCOURTPublisher:Houghton Mifflin Harcourt
 Holt Mcdougal Larson Pre-algebra: Student Edition...AlgebraISBN:9780547587776Author:HOLT MCDOUGALPublisher:HOLT MCDOUGAL
 Functions and Change: A Modeling Approach to Coll...AlgebraISBN:9781337111348Author:Bruce Crauder, Benny Evans, Alan NoellPublisher:Cengage Learning
Glencoe Algebra 1, Student Edition, 9780079039897...
Algebra
ISBN:9780079039897
Author:Carter
Publisher:McGraw Hill
Big Ideas Math A Bridge To Success Algebra 1: Stu...
Algebra
ISBN:9781680331141
Author:HOUGHTON MIFFLIN HARCOURT
Publisher:Houghton Mifflin Harcourt
Holt Mcdougal Larson Pre-algebra: Student Edition...
Algebra
ISBN:9780547587776
Author:HOLT MCDOUGAL
Publisher:HOLT MCDOUGAL
Functions and Change: A Modeling Approach to Coll...
Algebra
ISBN:9781337111348
Author:Bruce Crauder, Benny Evans, Alan Noell
Publisher:Cengage Learning
Statistics 4.1 Introduction to Inferential Statistics; Author: Dr. Jack L. Jackson II;https://www.youtube.com/watch?v=QLo4TEvBvK4;License: Standard YouTube License, CC-BY