Concept explainers
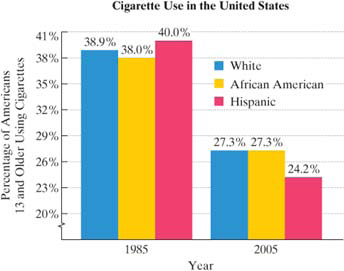
The bar graph shows the percentage of Americans who used cigarettes, by ethnicity, in 1985 and 2005. For each of the groups shown, cigarette use has been linearly decreasing. Use this information to solve Exercises 95–96.

In this exercise, let x represent the number of years after 1985 and let y represent the percentage of Americans in one of the groups shown who used cigarettes.
Use the data points (0, 38) and (20, 27.3) to find the slope-intercept equation of the line that models the percentage Ot African Americans Who used cigarettes, y, x years after 1985. Round the value of the slope m to two decimal places.
Use the data points (O, 40) and (20, 24.2) to find the slope-intercept equation of the line that models the percentage of Hispanics who used cigarettes. y, x years after 1985
Use the models from parts (a) and (b) to find the year during which cigarette use was the same for African Americans and Hispanics. What percentage of each group used cigarettes during that year?
Want to see the full answer?
Check out a sample textbook solution
Chapter 3 Solutions
EBK INTERMEDIATE ALGEBRA FOR COLLEGE ST
- e Grade Breakdown x Dashboard | Big Spring HX Dashboard | Big Spring H x Home | Lesson | Assessm cds.caolacourses.edisonlearning.com/lessons/assessmentplayer Co bigspringsd.org bookmarks Prodigy New Tab my video Brielynn... Algebra 2 Part 1-Exam-EDCP.MA003.A D Question 6 D ? 10 17°F Mostly sunny BSMS Home Significant Events in... Classes 25 26 27 28 29 30 31 32 33 34 35 36 37 38 39 40 Solve using row operations: x-3y= -4; 2x - y = 7 Use the paperclip button below to attach files. Student can enter max 2000 characters BISU DAIAAA X2 X2 T ② Type here Q Search e I ✓ Paragra Oarrow_forward1+3+5+7+ …+300 using gauss’s problemarrow_forwardFactor the expression. 5x³ (x²+8x)² - 35x (x²+8x) 2arrow_forward

 Glencoe Algebra 1, Student Edition, 9780079039897...AlgebraISBN:9780079039897Author:CarterPublisher:McGraw Hill

