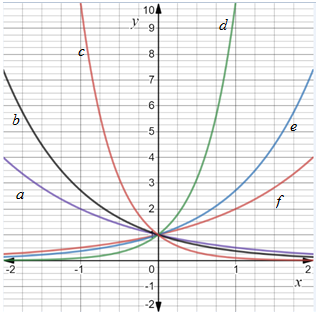
HOW DO YOU SEE IT? The figure shows the graphs of y = 2 x , y = e x , y = 10 x , y = 2 − x , y = e − x , a n d y = 10 − x . Match each function with its graph. [The graphs are labeled (a) through (f).] Explain your reasoning.
HOW DO YOU SEE IT? The figure shows the graphs of y = 2 x , y = e x , y = 10 x , y = 2 − x , y = e − x , a n d y = 10 − x . Match each function with its graph. [The graphs are labeled (a) through (f).] Explain your reasoning.
HOW DO YOU SEE IT? The figure shows the graphs of
y
=
2
x
,
y
=
e
x
,
y
=
10
x
,
y
=
2
−
x
,
y
=
e
−
x
,
a
n
d
y
=
10
−
x
. Match each function with its graph. [The graphs are labeled (a) through (f).] Explain your reasoning.
Determine whether the lines
L₁ (t) = (-2,3, −1)t + (0,2,-3) and
L2 p(s) = (2, −3, 1)s + (-10, 17, -8)
intersect. If they do, find the point of intersection.
Convert the line given by the parametric equations y(t)
Enter the symmetric equations in alphabetic order.
(x(t)
= -4+6t
= 3-t
(z(t)
=
5-7t
to symmetric equations.
Find the point at which the line (t) = (4, -5,-4)+t(-2, -1,5) intersects the xy plane.
Need a deep-dive on the concept behind this application? Look no further. Learn more about this topic, calculus and related others by exploring similar questions and additional content below.


 Algebra & Trigonometry with Analytic GeometryAlgebraISBN:9781133382119Author:SwokowskiPublisher:Cengage
 Glencoe Algebra 1, Student Edition, 9780079039897...AlgebraISBN:9780079039897Author:CarterPublisher:McGraw Hill
 Big Ideas Math A Bridge To Success Algebra 1: Stu...AlgebraISBN:9781680331141Author:HOUGHTON MIFFLIN HARCOURTPublisher:Houghton Mifflin Harcourt
 Holt Mcdougal Larson Pre-algebra: Student Edition...AlgebraISBN:9780547587776Author:HOLT MCDOUGALPublisher:HOLT MCDOUGAL
