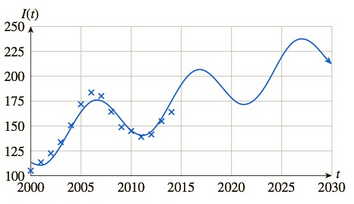
Home Prices: Optimist Projection The following graph shows the values of the home price index for 2000–2014 together with another mathematical model I extrapolating the data: Estimate and interpret lim t → + ∞ I ( t ) .
Home Prices: Optimist Projection The following graph shows the values of the home price index for 2000–2014 together with another mathematical model I extrapolating the data: Estimate and interpret lim t → + ∞ I ( t ) .
Solution Summary: The author analyzes how the graph shows the values of the home price index for years 2000-2014 and interprets the answer. They conclude that the value of limit is +infty .
Home Prices: Optimist Projection The following graph shows the values of the home price index for 2000–2014 together with another mathematical model I extrapolating the data:
Solve the following heat equation by method of separation variables:
ди
=
at
subject to
u(0,t) =0, for
-16024
ძx2 •
t>0, 0 0,
ux (4,t) = 0, for
t> 0,
u(x, 0) =
(x-3,
\-1,
0 < x ≤2
2≤ x ≤ 4.
ex
5.
important aspects.
Graph f(x)=lnx. Be sure to make your graph big enough to easily read (use the space given.) Label all
6
33
Decide whether each limit exists. If a limit exists, estimate its
value.
11. (a) lim f(x)
x-3
f(x) ↑
4
3-
2+
(b) lim f(x)
x―0
-2
0
X
1234
Need a deep-dive on the concept behind this application? Look no further. Learn more about this topic, calculus and related others by exploring similar questions and additional content below.


 Algebra & Trigonometry with Analytic GeometryAlgebraISBN:9781133382119Author:SwokowskiPublisher:Cengage
 College Algebra (MindTap Course List)AlgebraISBN:9781305652231Author:R. David Gustafson, Jeff HughesPublisher:Cengage Learning