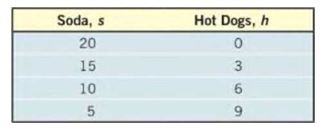
Developing a Linear Model from Data The following data represent the various combinations of soda and hot dogs that Yolanda can buy at a baseball game with $ 60 . a. Plot the ordered pairs ( s , h ) in a Cartesian plane. b. Show that the number of hot dogs purchased h is a linear function of the number of sodas purchased s . c. Determine the linear function that describes the relation between s and h . d. What is the implied domain of the linear function? e. Graph the linear function in the Cartesian plane drawn in part (a). f. Interpret the slope. g. Interpret the values of the intercepts.
Developing a Linear Model from Data The following data represent the various combinations of soda and hot dogs that Yolanda can buy at a baseball game with $ 60 . a. Plot the ordered pairs ( s , h ) in a Cartesian plane. b. Show that the number of hot dogs purchased h is a linear function of the number of sodas purchased s . c. Determine the linear function that describes the relation between s and h . d. What is the implied domain of the linear function? e. Graph the linear function in the Cartesian plane drawn in part (a). f. Interpret the slope. g. Interpret the values of the intercepts.
Solution Summary: The author explains how to calculate the linear function in a Cartesian plane.
Developing a Linear Model from Data The following data represent the various combinations of soda and hot dogs that Yolanda can buy at a baseball game with
.
a. Plot the ordered pairs
in a Cartesian plane.
b. Show that the number of hot dogs purchased
is a linear function of the number of sodas purchased
.
c. Determine the linear function that describes the relation between
and
.
d. What is the implied domain of the linear function?
e. Graph the linear function in the Cartesian plane drawn in part (a).
2. [-/4 Points]
DETAILS
MY NOTES
SESSCALCET2 7.3.002.
Let S be the solid obtained by rotating the region shown in the figure about the y-axis. (Assume a = 6 and b = 2.)
ASK YOUR TEACHER
0
y = a sin(bx²)
Sketch a typical approximating shell.
y
6
4
2
x
π/b
y
2
1
x
0.5
1.0
1.5
0.2
0.4
0.6
0.8
1.0
-2
-1
-4
The graph of f', the derivative of f, is shown in the graph below. If f(-9) = -5, what is the value of f(-1)?
y
87 19
6
LO
5
4
3
1
Graph of f'
x
-10 -9 -8 -7 -6 -5 -4 -3 -2 -1
1
2
3
4 5
6
7 8 9 10
-1
-2
-3
-4
-5
-6
-7
-8
564%
Let f(x)=−7e^xsinxf'(x)=
Chapter 3 Solutions
Precalculus Enhanced with Graphing Utilities Plus MyLab Math with Pearson eText - Access Card Package (7th Edition) (Sullivan & Sullivan Precalculus Titles)
Need a deep-dive on the concept behind this application? Look no further. Learn more about this topic, calculus and related others by exploring similar questions and additional content below.


 Intermediate AlgebraAlgebraISBN:9781285195728Author:Jerome E. Kaufmann, Karen L. SchwittersPublisher:Cengage Learning
 Algebra for College StudentsAlgebraISBN:9781285195780Author:Jerome E. Kaufmann, Karen L. SchwittersPublisher:Cengage Learning
 Elementary Geometry For College Students, 7eGeometryISBN:9781337614085Author:Alexander, Daniel C.; Koeberlein, Geralyn M.Publisher:Cengage,
 Elementary AlgebraAlgebraISBN:9780998625713Author:Lynn Marecek, MaryAnne Anthony-SmithPublisher:OpenStax - Rice University
 Glencoe Algebra 1, Student Edition, 9780079039897...AlgebraISBN:9780079039897Author:CarterPublisher:McGraw Hill
 Algebra: Structure And Method, Book 1AlgebraISBN:9780395977224Author:Richard G. Brown, Mary P. Dolciani, Robert H. Sorgenfrey, William L. ColePublisher:McDougal Littell