
Videos
Enrollments for Selected Independent Religiously Controlled 4-Year Colleges Listed below are the enrollments for selected independent religiously controlled 4-year colleges that offer bachelor’s degrees only. Construct a grouped frequency distribution with six classes and find the
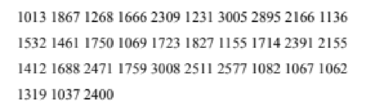
The frequency distribution for given data; the mean and modal class of the given data.
Answer to Problem 22E
The frequency distribution for given data is tabulated below:
| Class interval | Frequency |
| 1000-1499 | 13 |
| 1500-1999 | 9 |
| 2000-2499 | 5 |
| 2500-2999 | 2 |
| 3000-3499 | 2 |
| 3500-3999 | 0 |
| Total | 31 |
The mean of the data is 1825.26. The modal class for data is 1000-1499.
Explanation of Solution
Given info:
The data shows the enrollments for selected independent religiously controlled 4-years colleges.
Use number of class 6 for given data.
Calculation:
Steps to obtain the frequency distribution of given data
Step 1: The lowest value in the data set is 1013. The highest value in the data set is 3008.
Step 2: Calculate the class width using the formula,
Substitute 6 for number of classes, 1013 for minimum data value and 3008 for maximum data value in the above formula.
Step-3: Take a start value that is less than or equal to smallest value of data for this data take 1000 as start value.
Step 4: Add the class width of 500 to the starting value to obtain the second lower class limit is 1500. Continue to add the class width of 500 until six lower class limits are found. Thus, the lower class limits are 1000, 1500, 2000, 2500, 3000 and 3500.
Step 4: List the lower class limits vertically, to identify the corresponding upper class limits as shown in Table (1).
| Class interval |
| 1000- |
| 1500- |
| 2000- |
| 2500- |
| 3000- |
| 3500- |
Table (1)
Thus, the upper class limits are 1499, 1999, 2499, 2999, 3499-and 3999.
Step 5: Enter a tally mark for each data value in the appropriate class. Then add the tally marks to obtain the frequency for each class interval shown in Table (2).
| Service times (sec) | Tally mark | Frequency |
| 1000-1499 |
|
13 |
| 1500-1999 |
|
9 |
| 2000-2499 |
|
6 |
| 2500-2999 |
|
3 |
| 3000-3499 |
|
2 |
| 3500-3999 | 0 | |
| Total | 33 |
Table (2)
From the Table (2), it can be observed that the total frequency is 33 and the number of classes is 6.
The total number of frequency is,
The formula to calculate the mean is,
Where,
The sum of the total enrollments is give below:
Substitute
The modal class is the class with largest frequency.
Since, the class 1000-1499 has the largest frequency. Hence, it is modal class for data. Sometimes midpoint of the class is used it is 1249.5 for this data.
Want to see more full solutions like this?
Chapter 3 Solutions
ELEMENTARY STATISTICS CONNECT CODE>CUS


- At the same restaurant as in Question 19 with the same normal distribution, what's the chance of it taking no more than 15 minutes to get service?arrow_forwardClint, obviously not in college, sleeps an average of 8 hours per night with a standard deviation of 15 minutes. What's the chance of him sleeping between 7.5 and 8.5 hours on any given night? 0-(7-0) 200 91109s and doiw $20 (8-0) mol 8520 slang $199 galbrog seam side pide & D (newid se od poyesvig as PELEO PER AFTE editiw noudab temand van Czarrow_forwardTimes to complete a statistics exam have a normal distribution with a mean of 40 minutes and standard deviation of 6 minutes. Deshawn's time comes in at the 90th percentile. What percentage of the students are still working on their exams when Deshawn leaves?arrow_forward
- Suppose that the weights of cereal boxes have a normal distribution with a mean of 20 ounces and standard deviation of half an ounce. A box that has a standard score of o weighs how much? syed by ilog ni 21arrow_forwardBob scores 80 on both his math exam (which has a mean of 70 and standard deviation of 10) and his English exam (which has a mean of 85 and standard deviation of 5). Find and interpret Bob's Z-scores on both exams to let him know which exam (if either) he did bet- ter on. Don't, however, let his parents know; let them think he's just as good at both subjects. algas 70) sering digarrow_forwardSue's math class exam has a mean of 70 with a standard deviation of 5. Her standard score is-2. What's her original exam score?arrow_forward
- Clint sleeps an average of 8 hours per night with a standard deviation of 15 minutes. What's the chance he will sleep less than 7.5 hours tonight? nut bow visarrow_forwardSuppose that your score on an exam is directly at the mean. What's your standard score?arrow_forwardOne state's annual rainfall has a normal dis- tribution with a mean of 100 inches and standard deviation of 25 inches. Suppose that corn grows best when the annual rainfall is between 100 and 150 inches. What's the chance of achieving this amount of rainfall? wved now of sociarrow_forward
- 13 Suppose that your exam score has a standard score of 0.90. Does this mean that 90 percent of the other exam scores are lower than yours?arrow_forwardBob's commuting times to work have a nor- mal distribution with a mean of 45 minutes and standard deviation of 10 minutes. How often does Bob get to work in 30 to 45 minutes?arrow_forwardBob's commuting times to work have a nor- mal distribution with a mean of 45 minutes and standard deviation of 10 minutes. a. What percentage of the time does Bob get to work in 30 minutes or less? b. Bob's workday starts at 9 a.m. If he leaves at 8 a.m., how often is he late?arrow_forward
 Glencoe Algebra 1, Student Edition, 9780079039897...AlgebraISBN:9780079039897Author:CarterPublisher:McGraw Hill
 Big Ideas Math A Bridge To Success Algebra 1: Stu...AlgebraISBN:9781680331141Author:HOUGHTON MIFFLIN HARCOURTPublisher:Houghton Mifflin Harcourt
 Holt Mcdougal Larson Pre-algebra: Student Edition...AlgebraISBN:9780547587776Author:HOLT MCDOUGALPublisher:HOLT MCDOUGAL