For each probability experiment, determine the number of outcomes and identify the sample space . 1. A probability experiment consists of recording a response to the survey statement at the left and the gender of the respondent. 2. A probability experiment consists of recording a response to the survey statement at the left and the age (18–34, 35–49, 50 and older) of the respondent. 3. A probability experiment consists of recording a response to the survey statement at the left and the geographic location (Northeast, South, Midwest, West) of the respondent. Answer: Page A33
For each probability experiment, determine the number of outcomes and identify the sample space . 1. A probability experiment consists of recording a response to the survey statement at the left and the gender of the respondent. 2. A probability experiment consists of recording a response to the survey statement at the left and the age (18–34, 35–49, 50 and older) of the respondent. 3. A probability experiment consists of recording a response to the survey statement at the left and the geographic location (Northeast, South, Midwest, West) of the respondent. Answer: Page A33
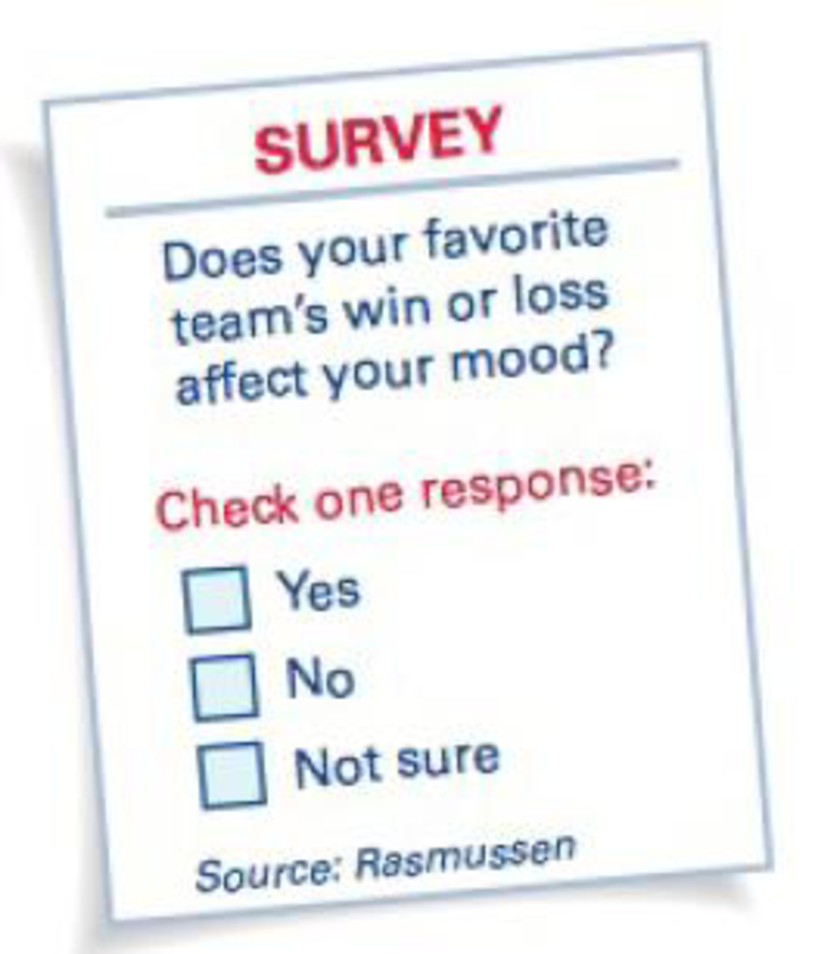
For each probability experiment, determine the number of outcomes and identify the sample space.
1. A probability experiment consists of recording a response to the survey statement at the left and the gender of the respondent.
2. A probability experiment consists of recording a response to the survey statement at the left and the age (18–34, 35–49, 50 and older) of the respondent.
3. A probability experiment consists of recording a response to the survey statement at the left and the geographic location (Northeast, South, Midwest, West) of the respondent.
Answer: Page A33
Definition Definition For any random event or experiment, the set that is formed with all the possible outcomes is called a sample space. When any random event takes place that has multiple outcomes, the possible outcomes are grouped together in a set. The sample space can be anything, from a set of vectors to real numbers.
8 (Correlation and Diversification)
Assume we have two stocks, A and B, show that a particular combination
of the two stocks produce a risk-free portfolio when the correlation between
the return of A and B is -1.
9 (Portfolio allocation)
Suppose R₁ and R2 are returns of 2 assets and with expected return and
variance respectively r₁ and 72 and variance-covariance σ2, 0%½ and σ12. Find
−∞ ≤ w ≤ ∞ such that the portfolio wR₁ + (1 - w) R₂ has the smallest
risk.
7 (Multivariate random variable)
Suppose X, €1, €2, €3 are IID N(0, 1) and
Y2
Y₁ = 0.2 0.8X + €1, Y₂ = 0.3 +0.7X+ €2, Y3 = 0.2 + 0.9X + €3.
=
(In models like this, X is called the common factors of Y₁, Y₂, Y3.)
Y = (Y1, Y2, Y3).
(a) Find E(Y) and cov(Y).
(b) What can you observe from cov(Y).
Write
University Calculus: Early Transcendentals (4th Edition)
Knowledge Booster
Learn more about
Need a deep-dive on the concept behind this application? Look no further. Learn more about this topic, statistics and related others by exploring similar questions and additional content below.


 College Algebra (MindTap Course List)AlgebraISBN:9781305652231Author:R. David Gustafson, Jeff HughesPublisher:Cengage Learning
 Holt Mcdougal Larson Pre-algebra: Student Edition...AlgebraISBN:9780547587776Author:HOLT MCDOUGALPublisher:HOLT MCDOUGAL

 Glencoe Algebra 1, Student Edition, 9780079039897...AlgebraISBN:9780079039897Author:CarterPublisher:McGraw Hill